Stratus Panel - Vitals
Alerts
-
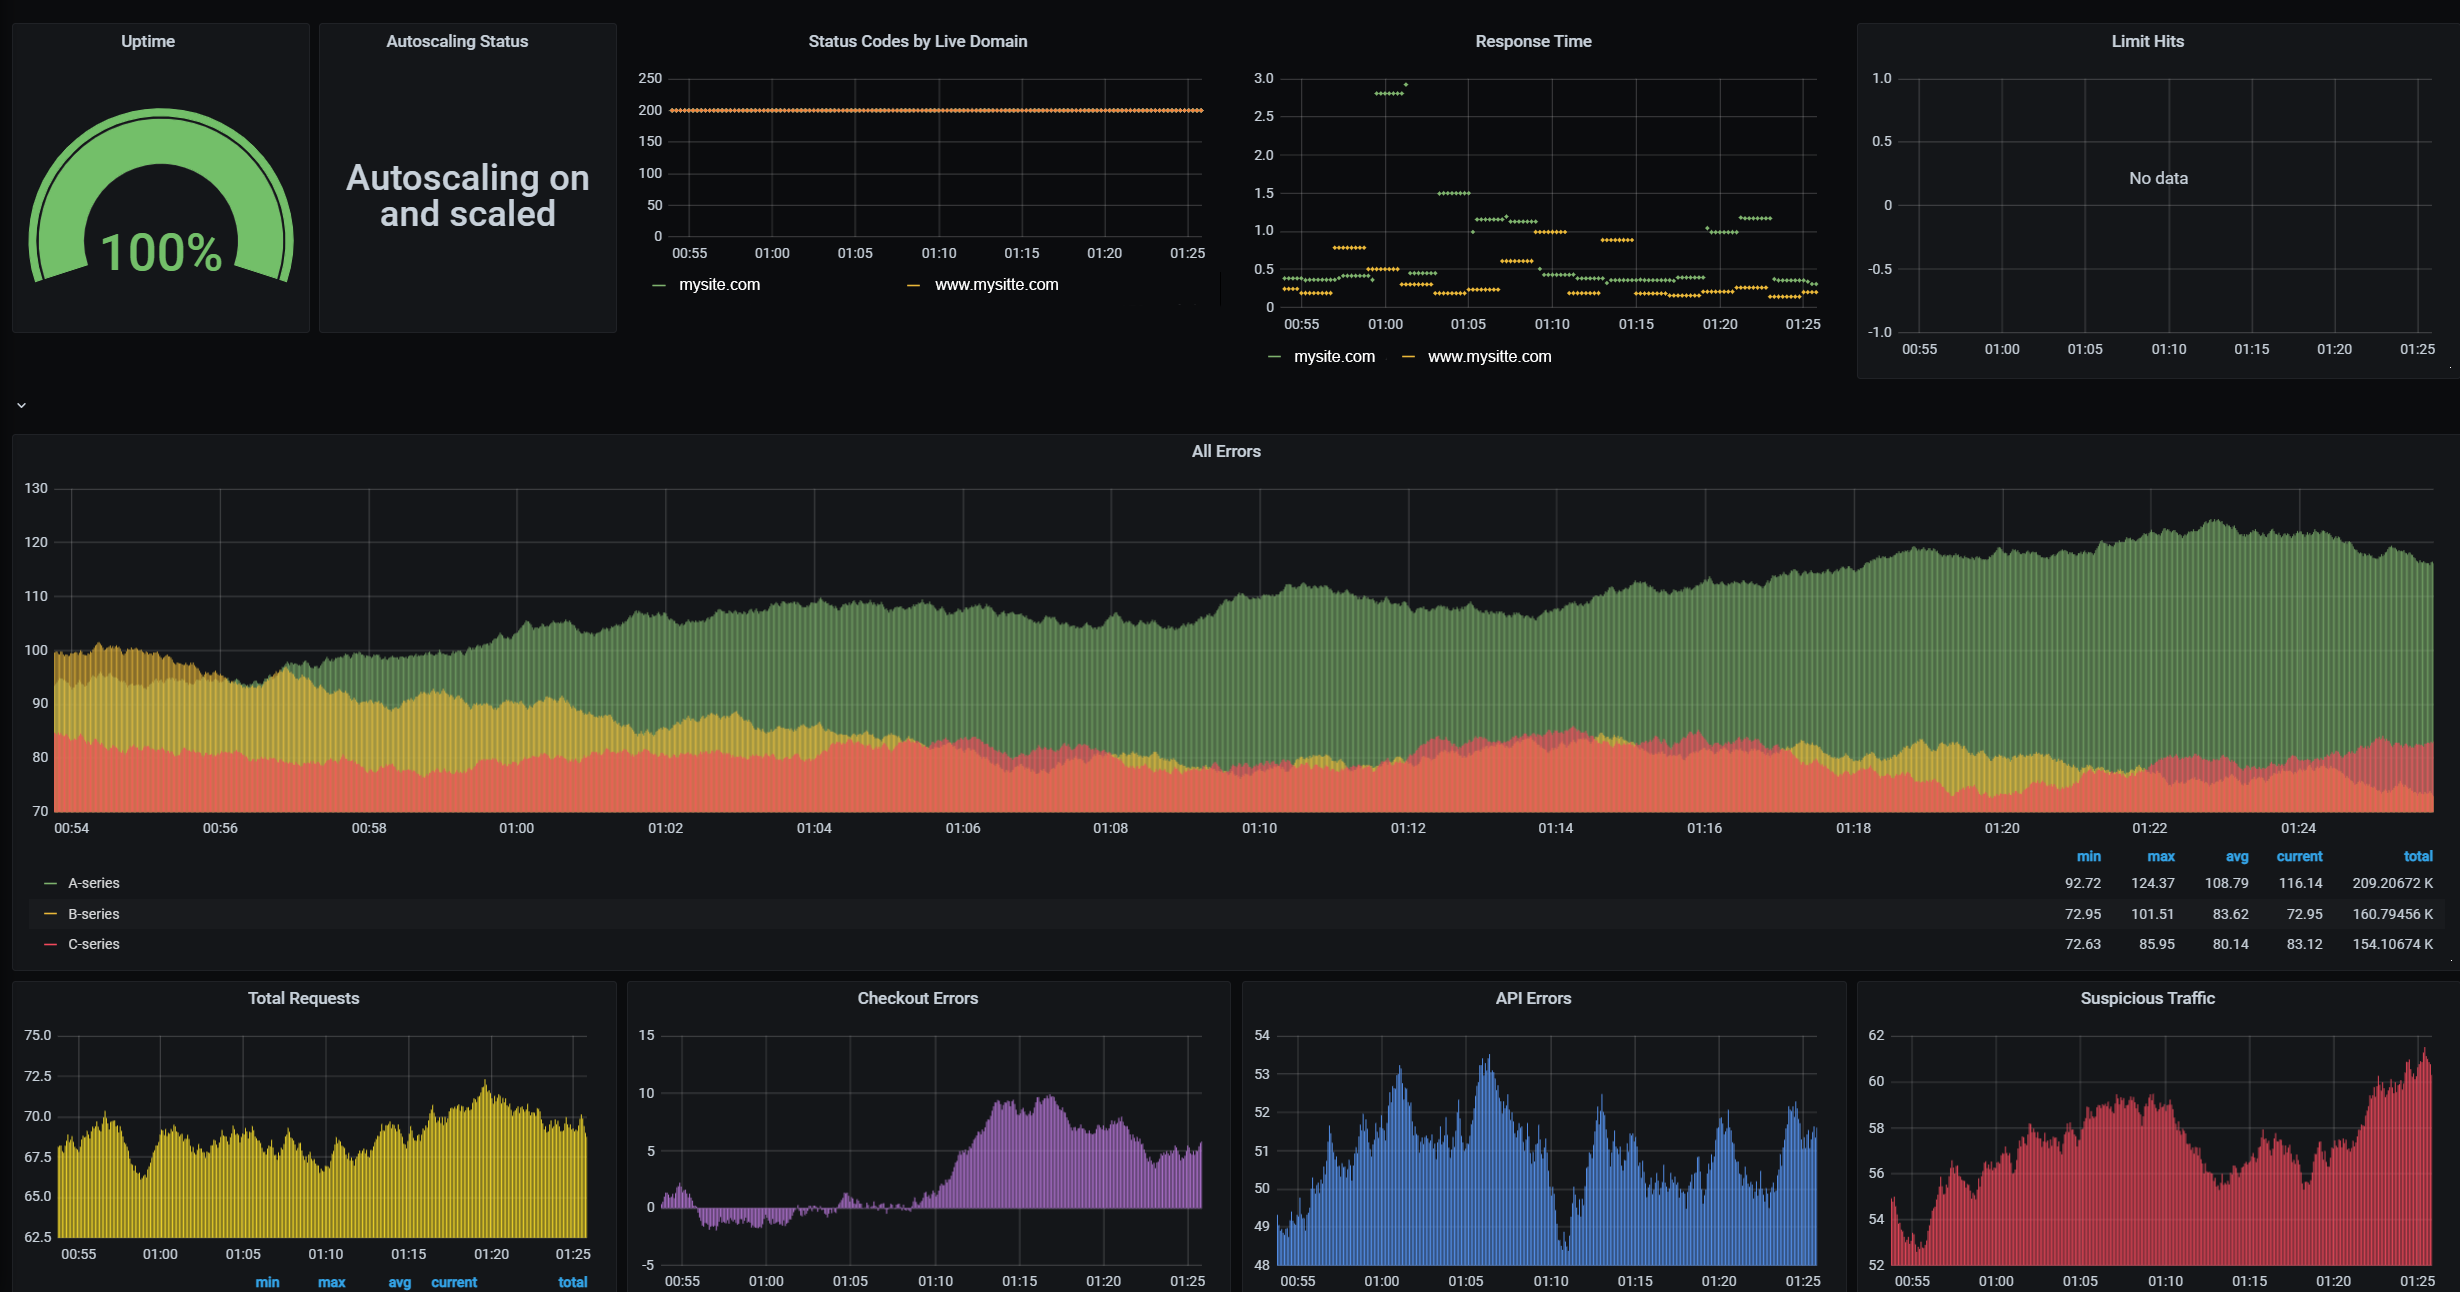
Uptime: Uptime based as probe success within the chosen time frame. Only monitored if your environment is considered live.
-
Autoscaling Status: This reports if Autoscaling is ON or OFF. If you are on a legacy Resource Based Plan (RBP), this will be N/A.
-
Status Codes: HTTP Status Codes per domain within the chosen time frame. Only monitored if your environment is considered live.
-
Response Time: Response time in seconds within the chosen time frame. Only monitored if your environment is considered live.
-
Limit Hits: This shows any service limits you have hit within the chosen time frame. If you find your production store routinely hitting limits, especially MySQL, the environment may need an upgrade.
-
All Errors: Total errors the site has received within the chosen time frame.
-
Total Requests: Total requests per second.
-
Checkout Errors: Errors the site has received related to checkout within the chosen time frame.
-
API Errors: Errors the site has received related to API within the chosen time frame.
-
Suspicious Traffic: Malicious Traffic hits within the chosen time frame.
NOTE: Your environment is counted as live when it uses a domain other than its Webscale provided temporary domain name. Development instances will not show this information.
Overview
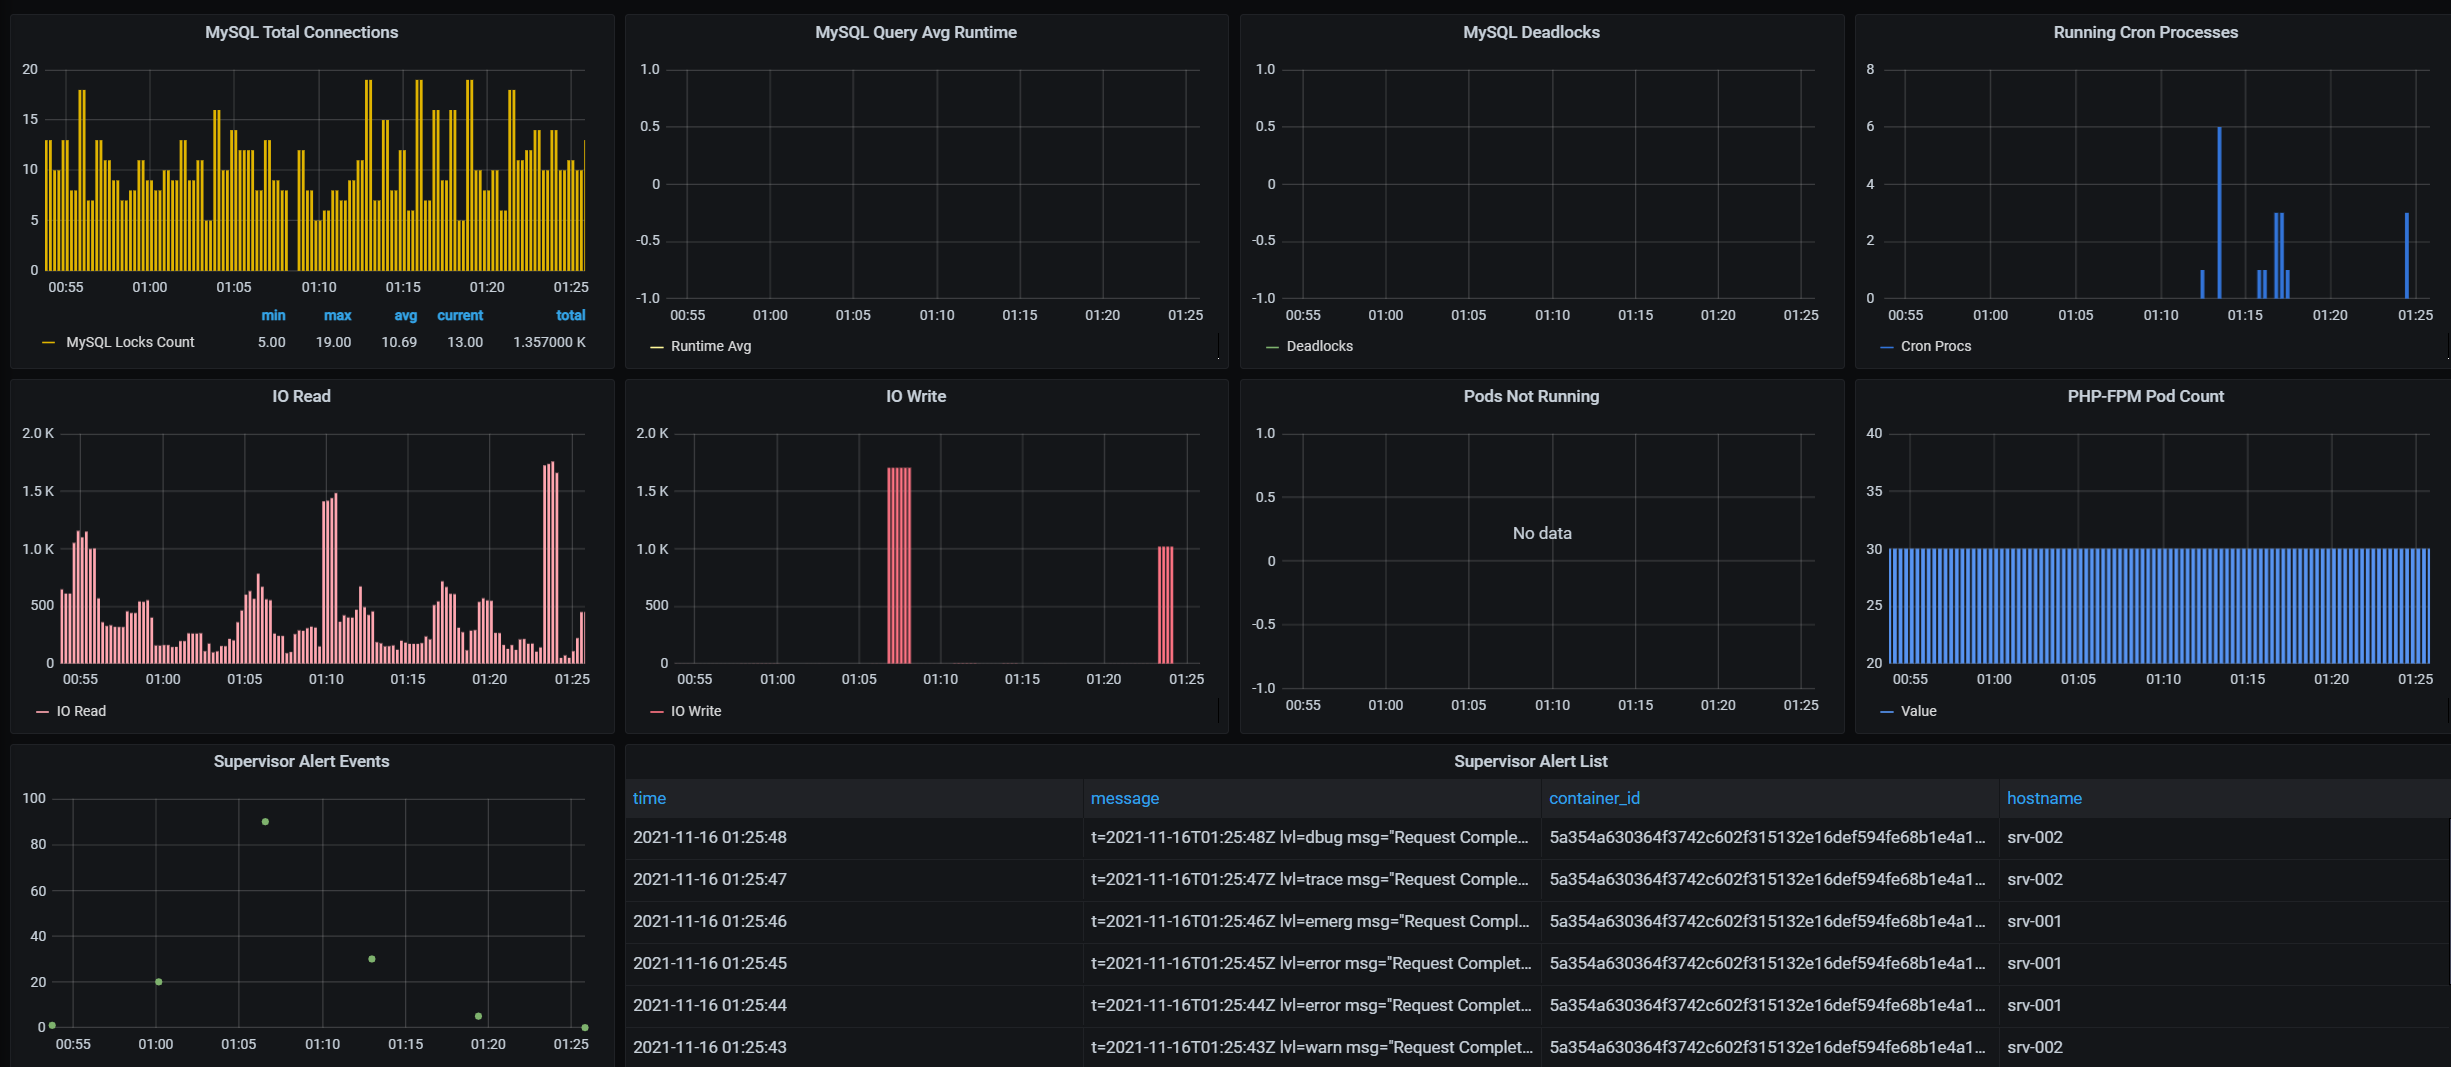
- MySQL Total connections: The total amount of MYSQL connections within the chosen time frame.
- MySQL Query Runtime: The average query Runtime for queries running in your environment.
- MySQL Deadlocks: MySQL locks that have occured in this environment within the chosen time frame.
- Running Cron Processes: The amount of running cron processes within the chosen time frame.
- IO Read: Input/Output reads to the file system and database for the environment within the chosen time frame.
- IO Write: Input/Output writes to the file system and database for the environment within the chosen time frame.
- Pods not running: The amount of pods not in the running state within the specified time frame. This can be due to a redeploy.
- PHP-FPM Pod Count: Count of PHP-FPM Pods. If Autoscaling is enabled, this graph will display the rise and fall of PHP-FPM pods which depends on the amount of traffic your environment is receiving. You will also see this change during zero downtime deployments after a new set of pods is launched during a deploy & before a switch takes place.
- Supervisor Alert Events: A graphical representation of Supervisor events that have occured within the chosen time frame.
- Supervisor Alert List: This is a list of Alerts related to Health checks in your environment such as Runaway MySQL processes, Runaway Crons, or High IO, CPU, Swap Memory or Load Average.
Service Detail
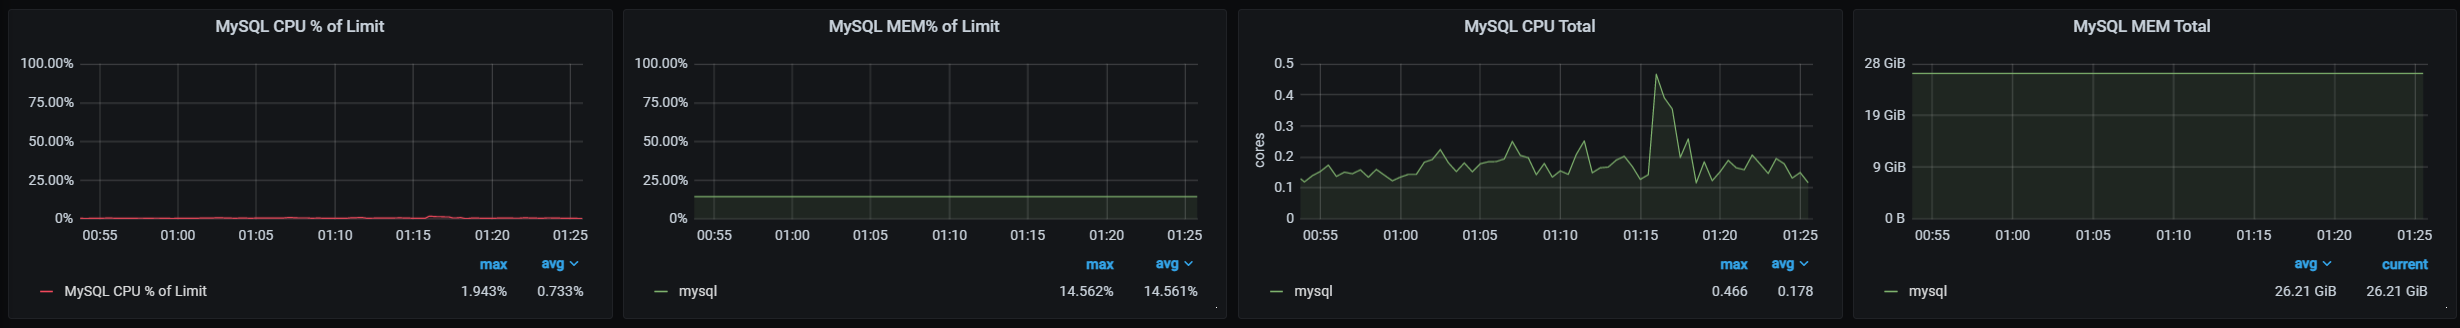
Webscale STRATUS Vitals provides CPU & Memory information for the services in your environment.
MySQL
- CPU % of Limit: MySQL CPU usage as a percentage of the limit provided by your plan.
- MEM % of Limit: MySQL Memory usage as a percentage of the limit provided by your plan.
- CPU Total: The total amount of CPU cores used by MySQL.
- MEM Total: The total amount of Memory used by MySQL. If this is high, it can signify that you need to upgrade your plan.
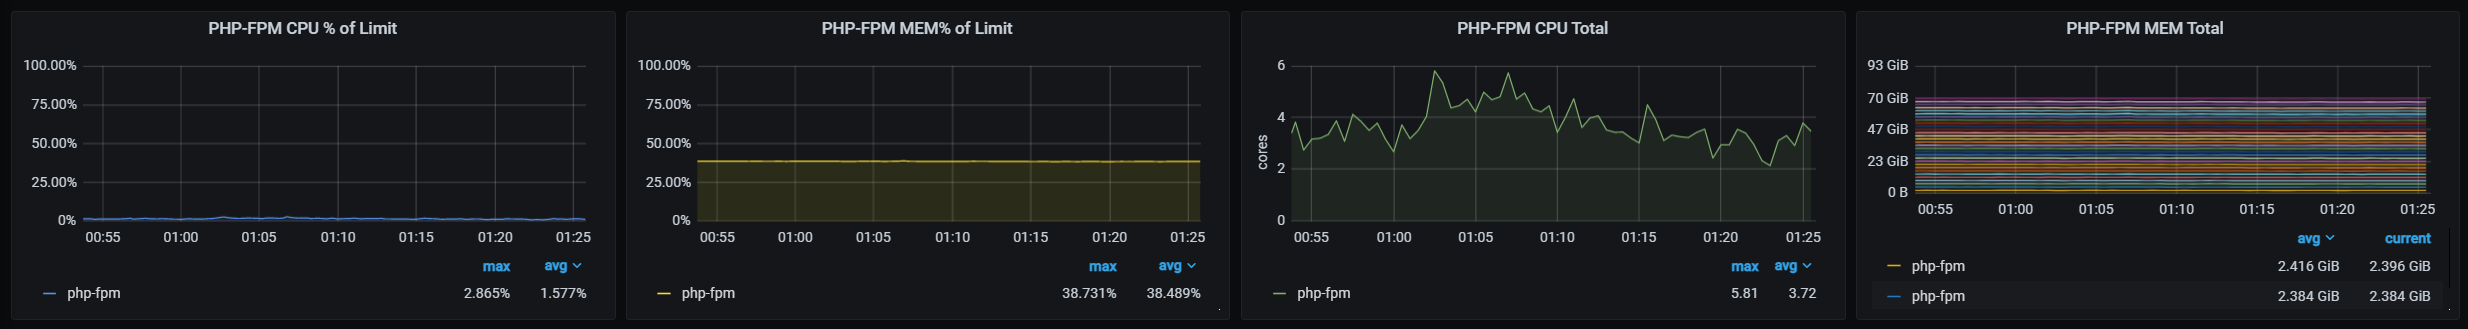
PHP-FPM
- CPU % of Limit: PHP-FPM CPU usage as a percentage of the limit.
- MEM % of Limit: PHP-FPM Memory usage as a percentage of the limit.
- CPU Total: The total amount of CPU cores used by PHP-FPM pods.
- MEM Total: The total amount of Memory used by PHP-FPM pods.
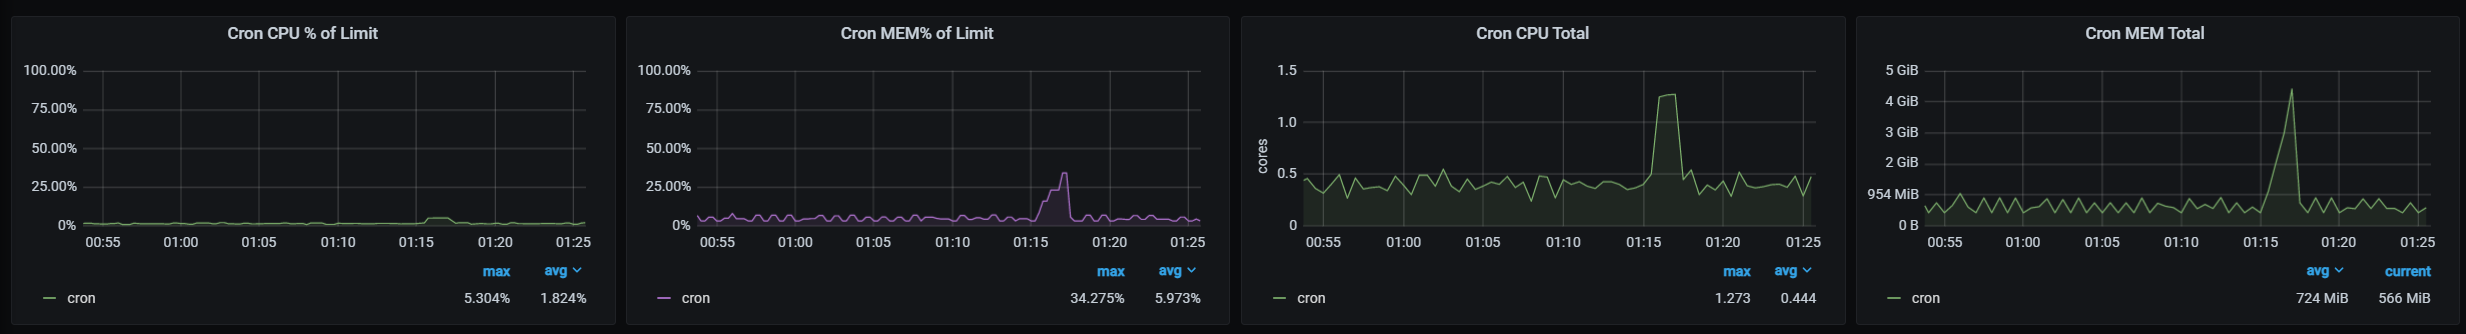
Cron
- CPU % of Limit: Cron CPU usage as a percentage of the limit provided by your plan.
- MEM % of Limit: Cron Memory usage as a percentage of the limit provided by your plan.
- CPU Total: The total amount of CPU cores used by Cron.
- MEM Total: The total amount of Memory used by Cron.
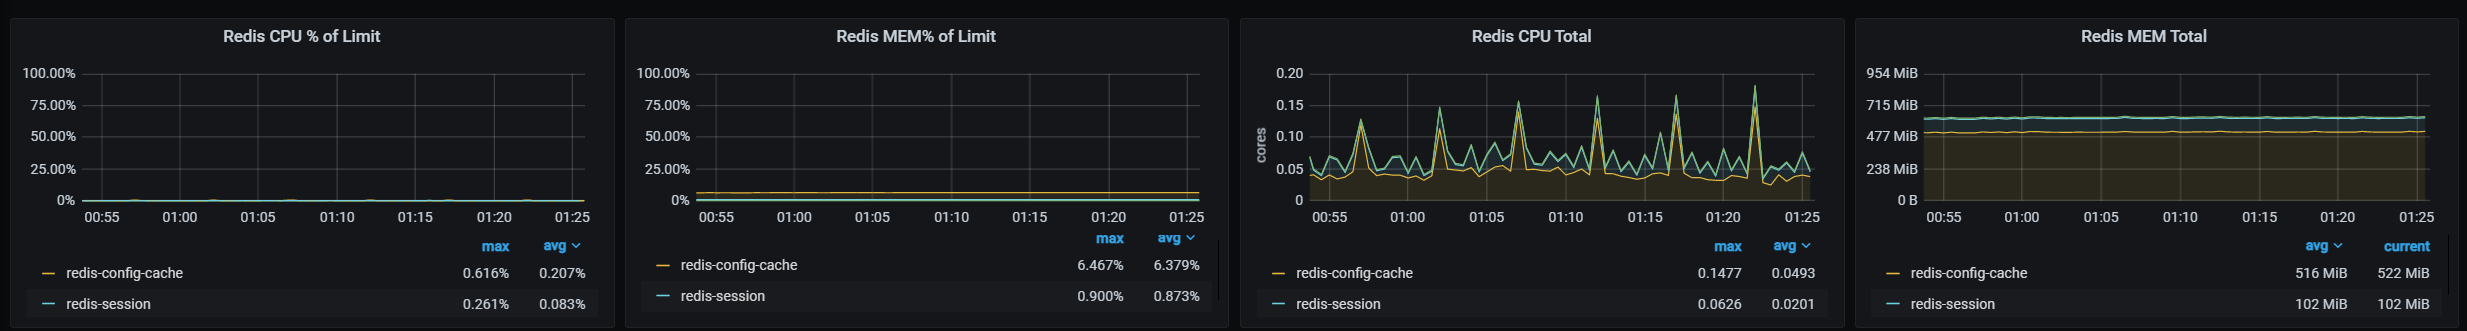
Redis
- CPU % of Limit: Redis, Redis Config Cache & Redis Session CPU usage as a percentage of the limit provided by your plan.
- MEM % of Limit: Redis, Redis Config Cache & Redis Session Memory usage as a percentage of the limit provided by your plan.
- CPU Total: The total amount of CPU cores used by Redis, Redis Config Cache & Redis Sessions.
- MEM Total: The total amount of Memory used by Redis, Redis Config Cache & Redis Sessions.
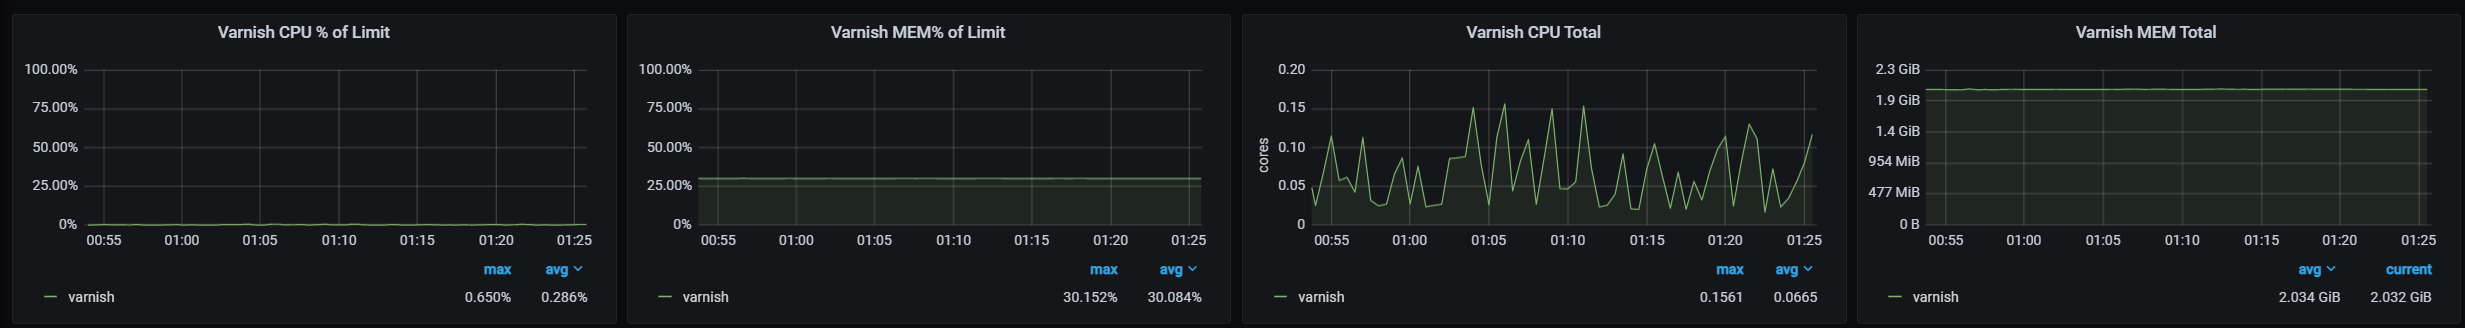
Varnish
- CPU % of Limit: Varnish CPU usage as a percentage of the limit provided by your plan.
- MEM % of Limit: Varnish Memory usage as a percentage of the limit provided by your plan.
- CPU Total: The total amount of CPU cores used by Varnish.
- MEM Total: The total amount of Memory used by Varnish.
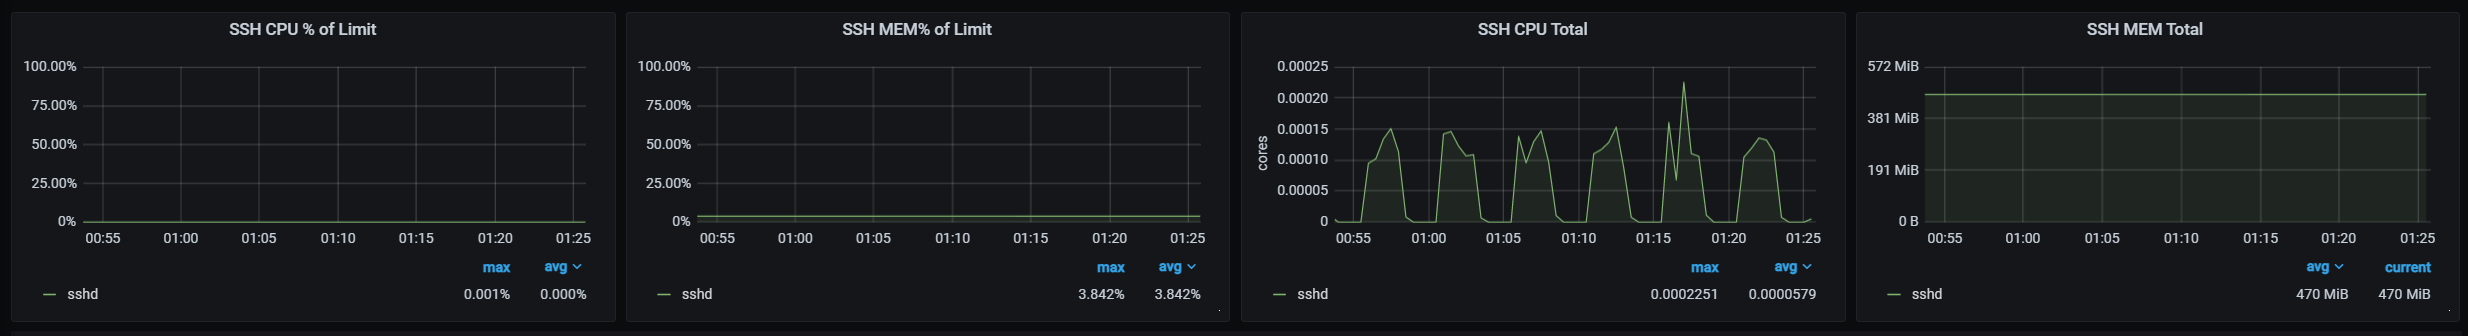
SSH
- CPU % of Limit: SSH usage as a percentage of the limit provided by your plan.
- MEM % of Limit: SSH Memory usage as a percentage of the limit provided by your plan.
- CPU Total: The total amount of CPU cores used by the SSH container.
- MEM Total: The total amount of Memory used by the SSH container.
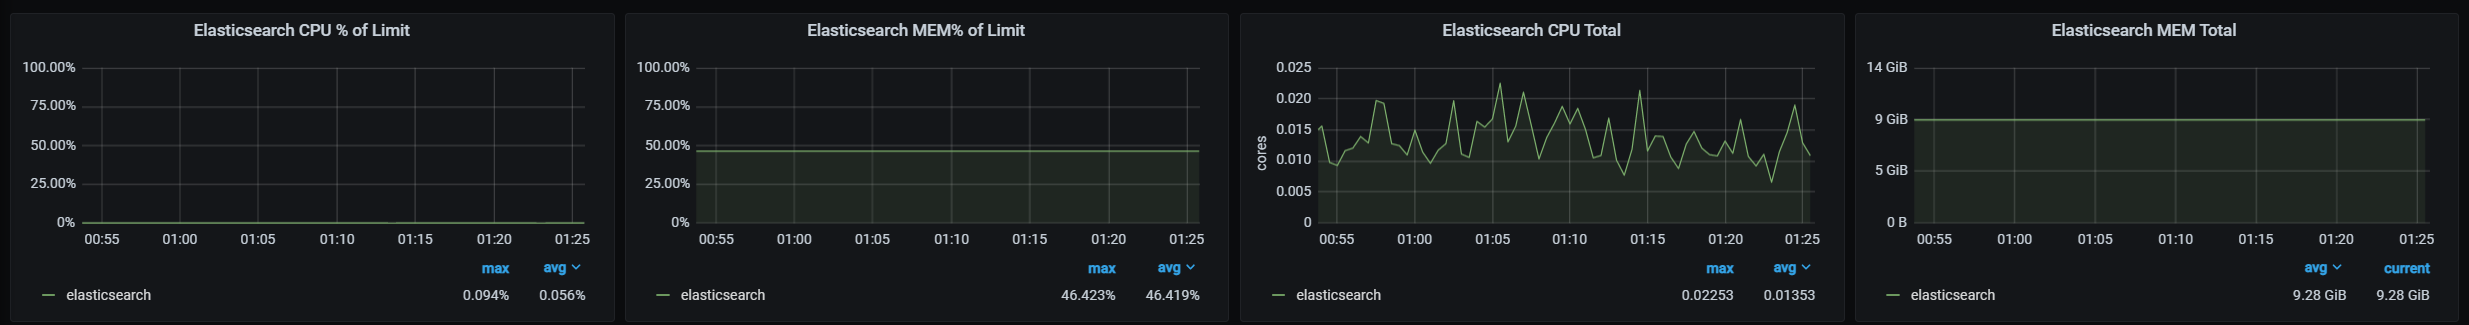
Elasticsearch
- CPU % of Limit: Elasticsearch CPU usage as a percentage of the limit provided by your plan.
- MEM % of Limit: Elasticsearch Memory usage as a percentage of the limit provided by your plan.
- CPU Total: The total amount of CPU cores used by Elasticsearch.
- MEM Total: The total amount of Memory used by Elasticsearch.
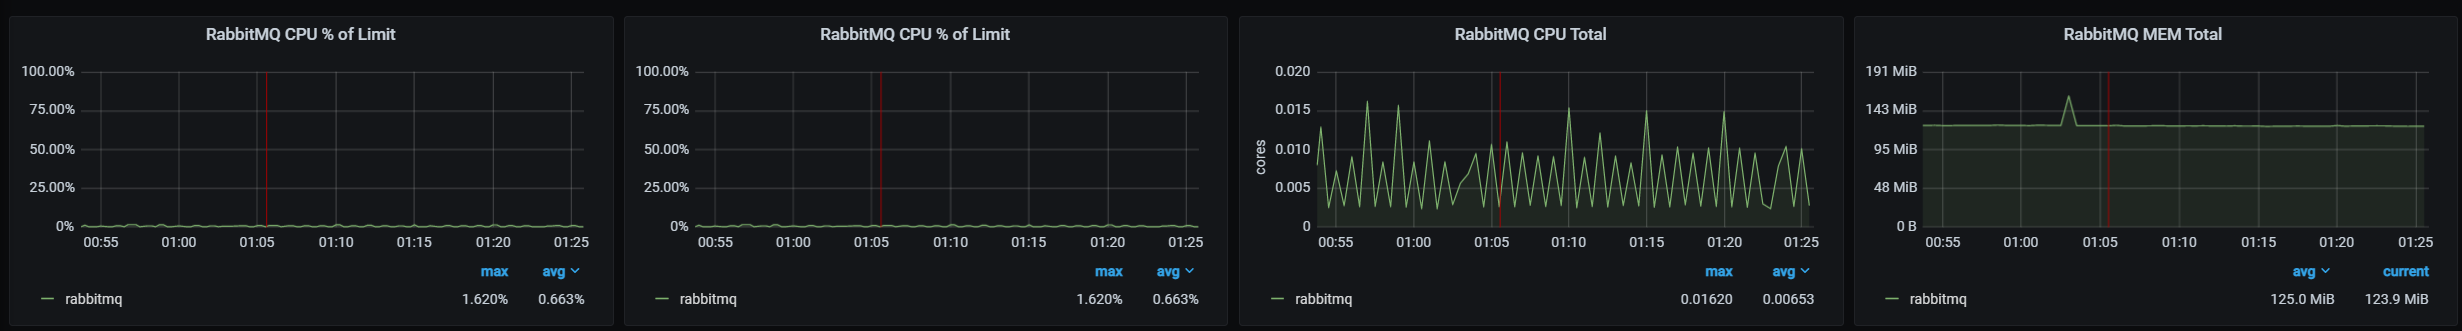
RabbitMQ
- CPU % of Limit: RabbitMQ CPU usage as a percentage of the limit provided by your plan.
- MEM % of Limit: RabbitMQ Memory usage as a percentage of the limit provided by your plan.
- CPU Total: The total amount of CPU cores used by RabbitMQ.
- MEM Total: The total amount of Memory used by RabbitMQ.
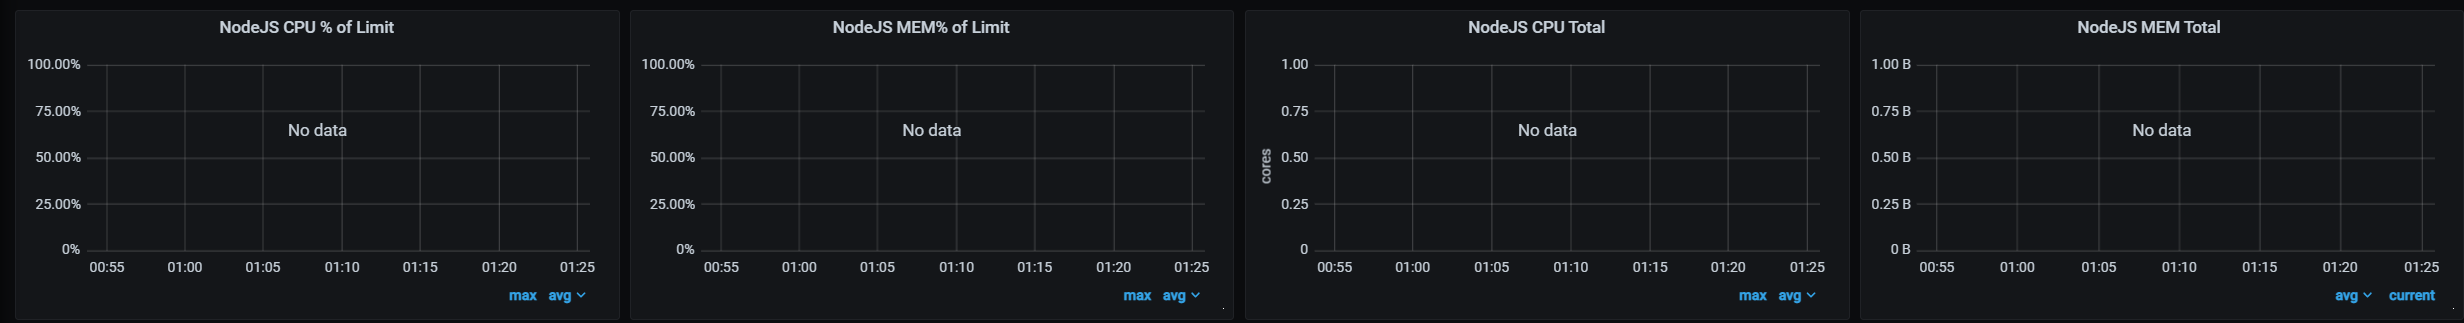
NodeJS
- CPU % of Limit: NodeJS CPU usage as a percentage of the limit provided by your plan.
- MEM % of Limit: NodeJS Memory usage as a percentage of the limit provided by your plan.
- CPU Total: The total amount of CPU cores used by NodeJS.
- MEM Total: The total amount of Memory used by NodeJS.
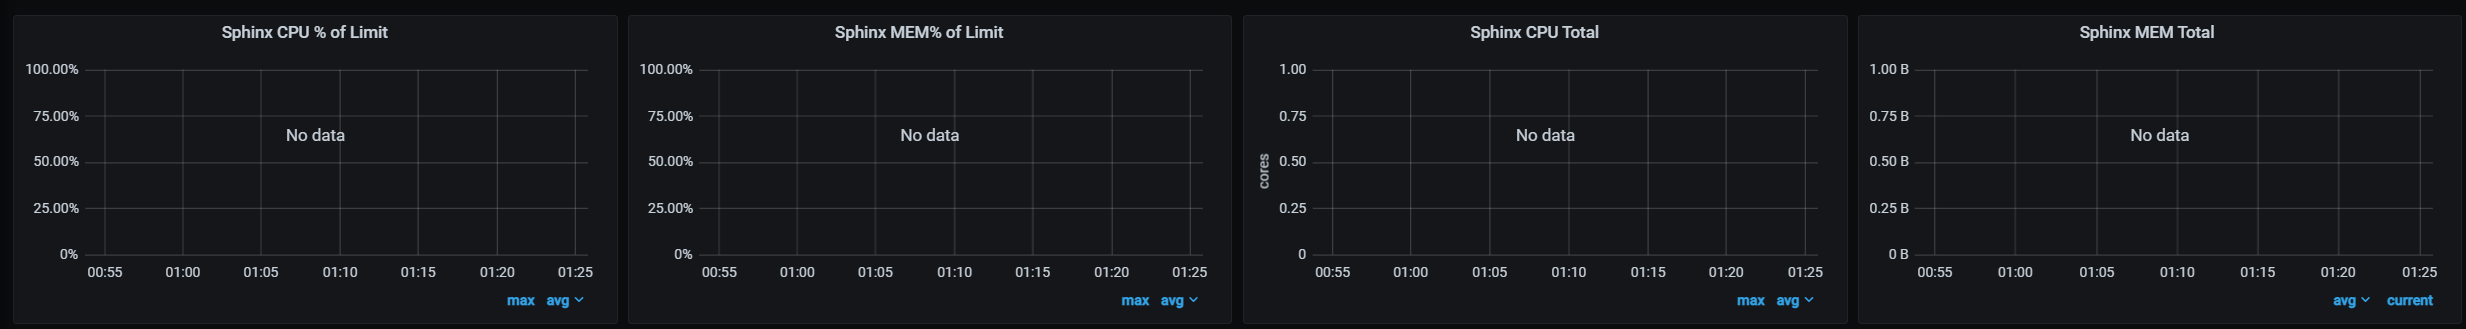
Sphinx
- CPU % of Limit: Sphinx CPU usage as a percentage of the limit provided by your plan.
- MEM % of Limit: Sphinx Memory usage as a percentage of the limit provided by your plan.
- CPU Total: The total amount of CPU cores used by Sphinx.
- MEM Total: The total amount of Memory used by Sphinx.
Memcache
- CPU % of Limit: Memcache CPU usage as a percentage of the limit provided by your plan.
- MEM % of Limit: Memcache Memory usage as a percentage of the limit provided by your plan.
- CPU Total: The total amount of CPU cores used by Memcache.
- MEM Total: The total amount of Memory used by Memcache.
Feedback
Was this page helpful?
Glad to hear it! Have any more feedback? Please share it here.
Sorry to hear that. Have any more feedback? Please share it here.