Application Analytics Dashboards
Opening the Analytics Dashboards
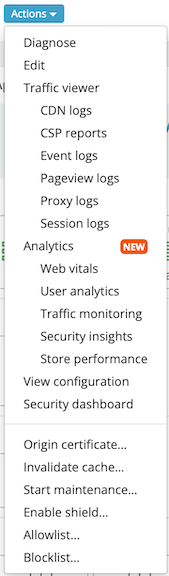
If your application is subscribed to one or more of our analytics dashboards, they can be accessed from the application actions menu. From the account dashboard, the application action menu can be opened by clicking the three vertical dots icon , or from the application dashboard, clicking the Actions button.
Note:
In order to use this capability, your account must be entitled to an analytics plan and your application must be subscribed to that plan. This can be configured by your Support representative.Clicking one of the analytics options in the menu will navigate you to the corresponding analytics dashboard:
The time range displayed for each dashboard can be configured using the dropdown select in the top corner of the page. The configurable time range is limited to 30 days, but if you have live log retention configured to be shorter than that, some charts will display empty data when selecting ranges beyond your configured retention.
All charts display tooltips with additional information when you hover over the chart’s contents. For charts with multiple data points, hovering an item in the legend will highlight it on the chart, and clicking it will hide it on the chart.
Dashboards
Web vitals
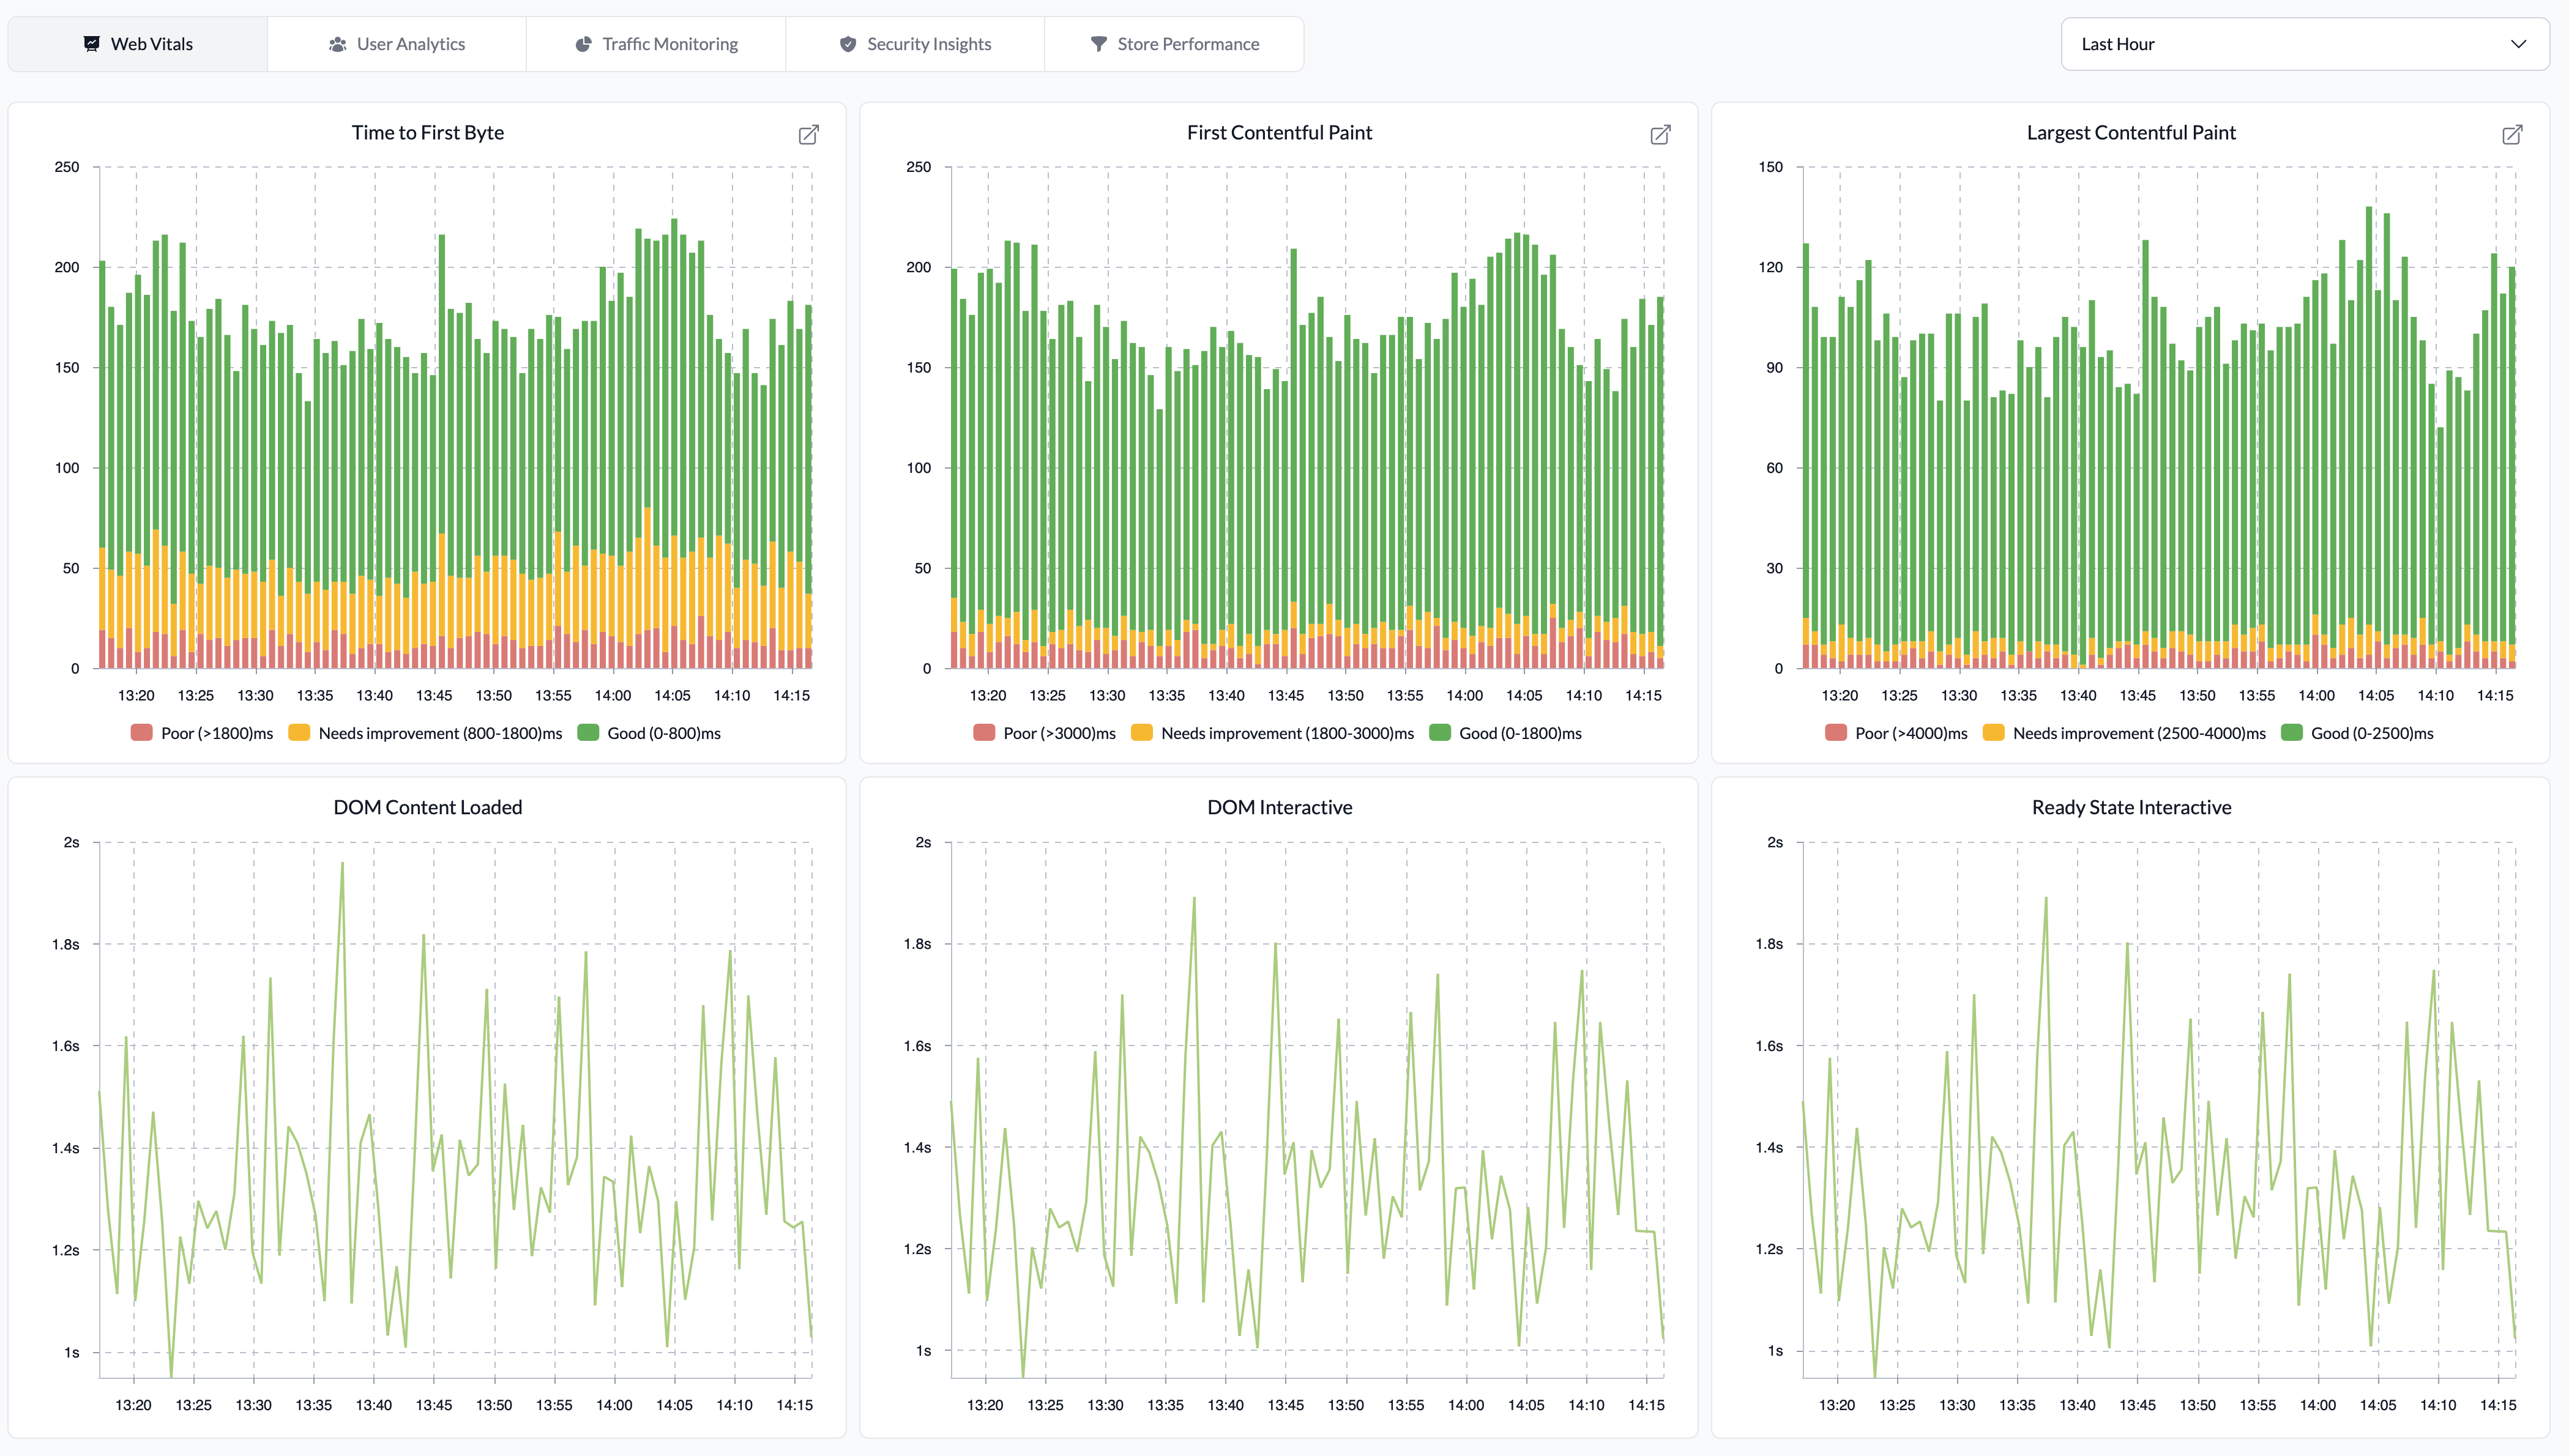
Web vitals measure the speed, responsiveness and visual stability of a page for the purpose of determining the quality of your site’s user experience. These metrics are each considered by Google Search to determine a site’s ranking. As a result, keeping an eye on your site’s metrics is important.
To this end, the Web vitals dashboard allows you to quickly take the pulse of your user experience. For each page load, the time to first byte, first contentful paint and largest contentful paint metrics are recorded. In this dashboard, each metric groups page loads according to the perceived user experience: Poor, Needs improvement and Good.
Additionally, the average DOM content loaded, DOM interactive and ready state interactive metrics, all of which measure how quickly a page loads and becomes interactive, are reported.
User analytics
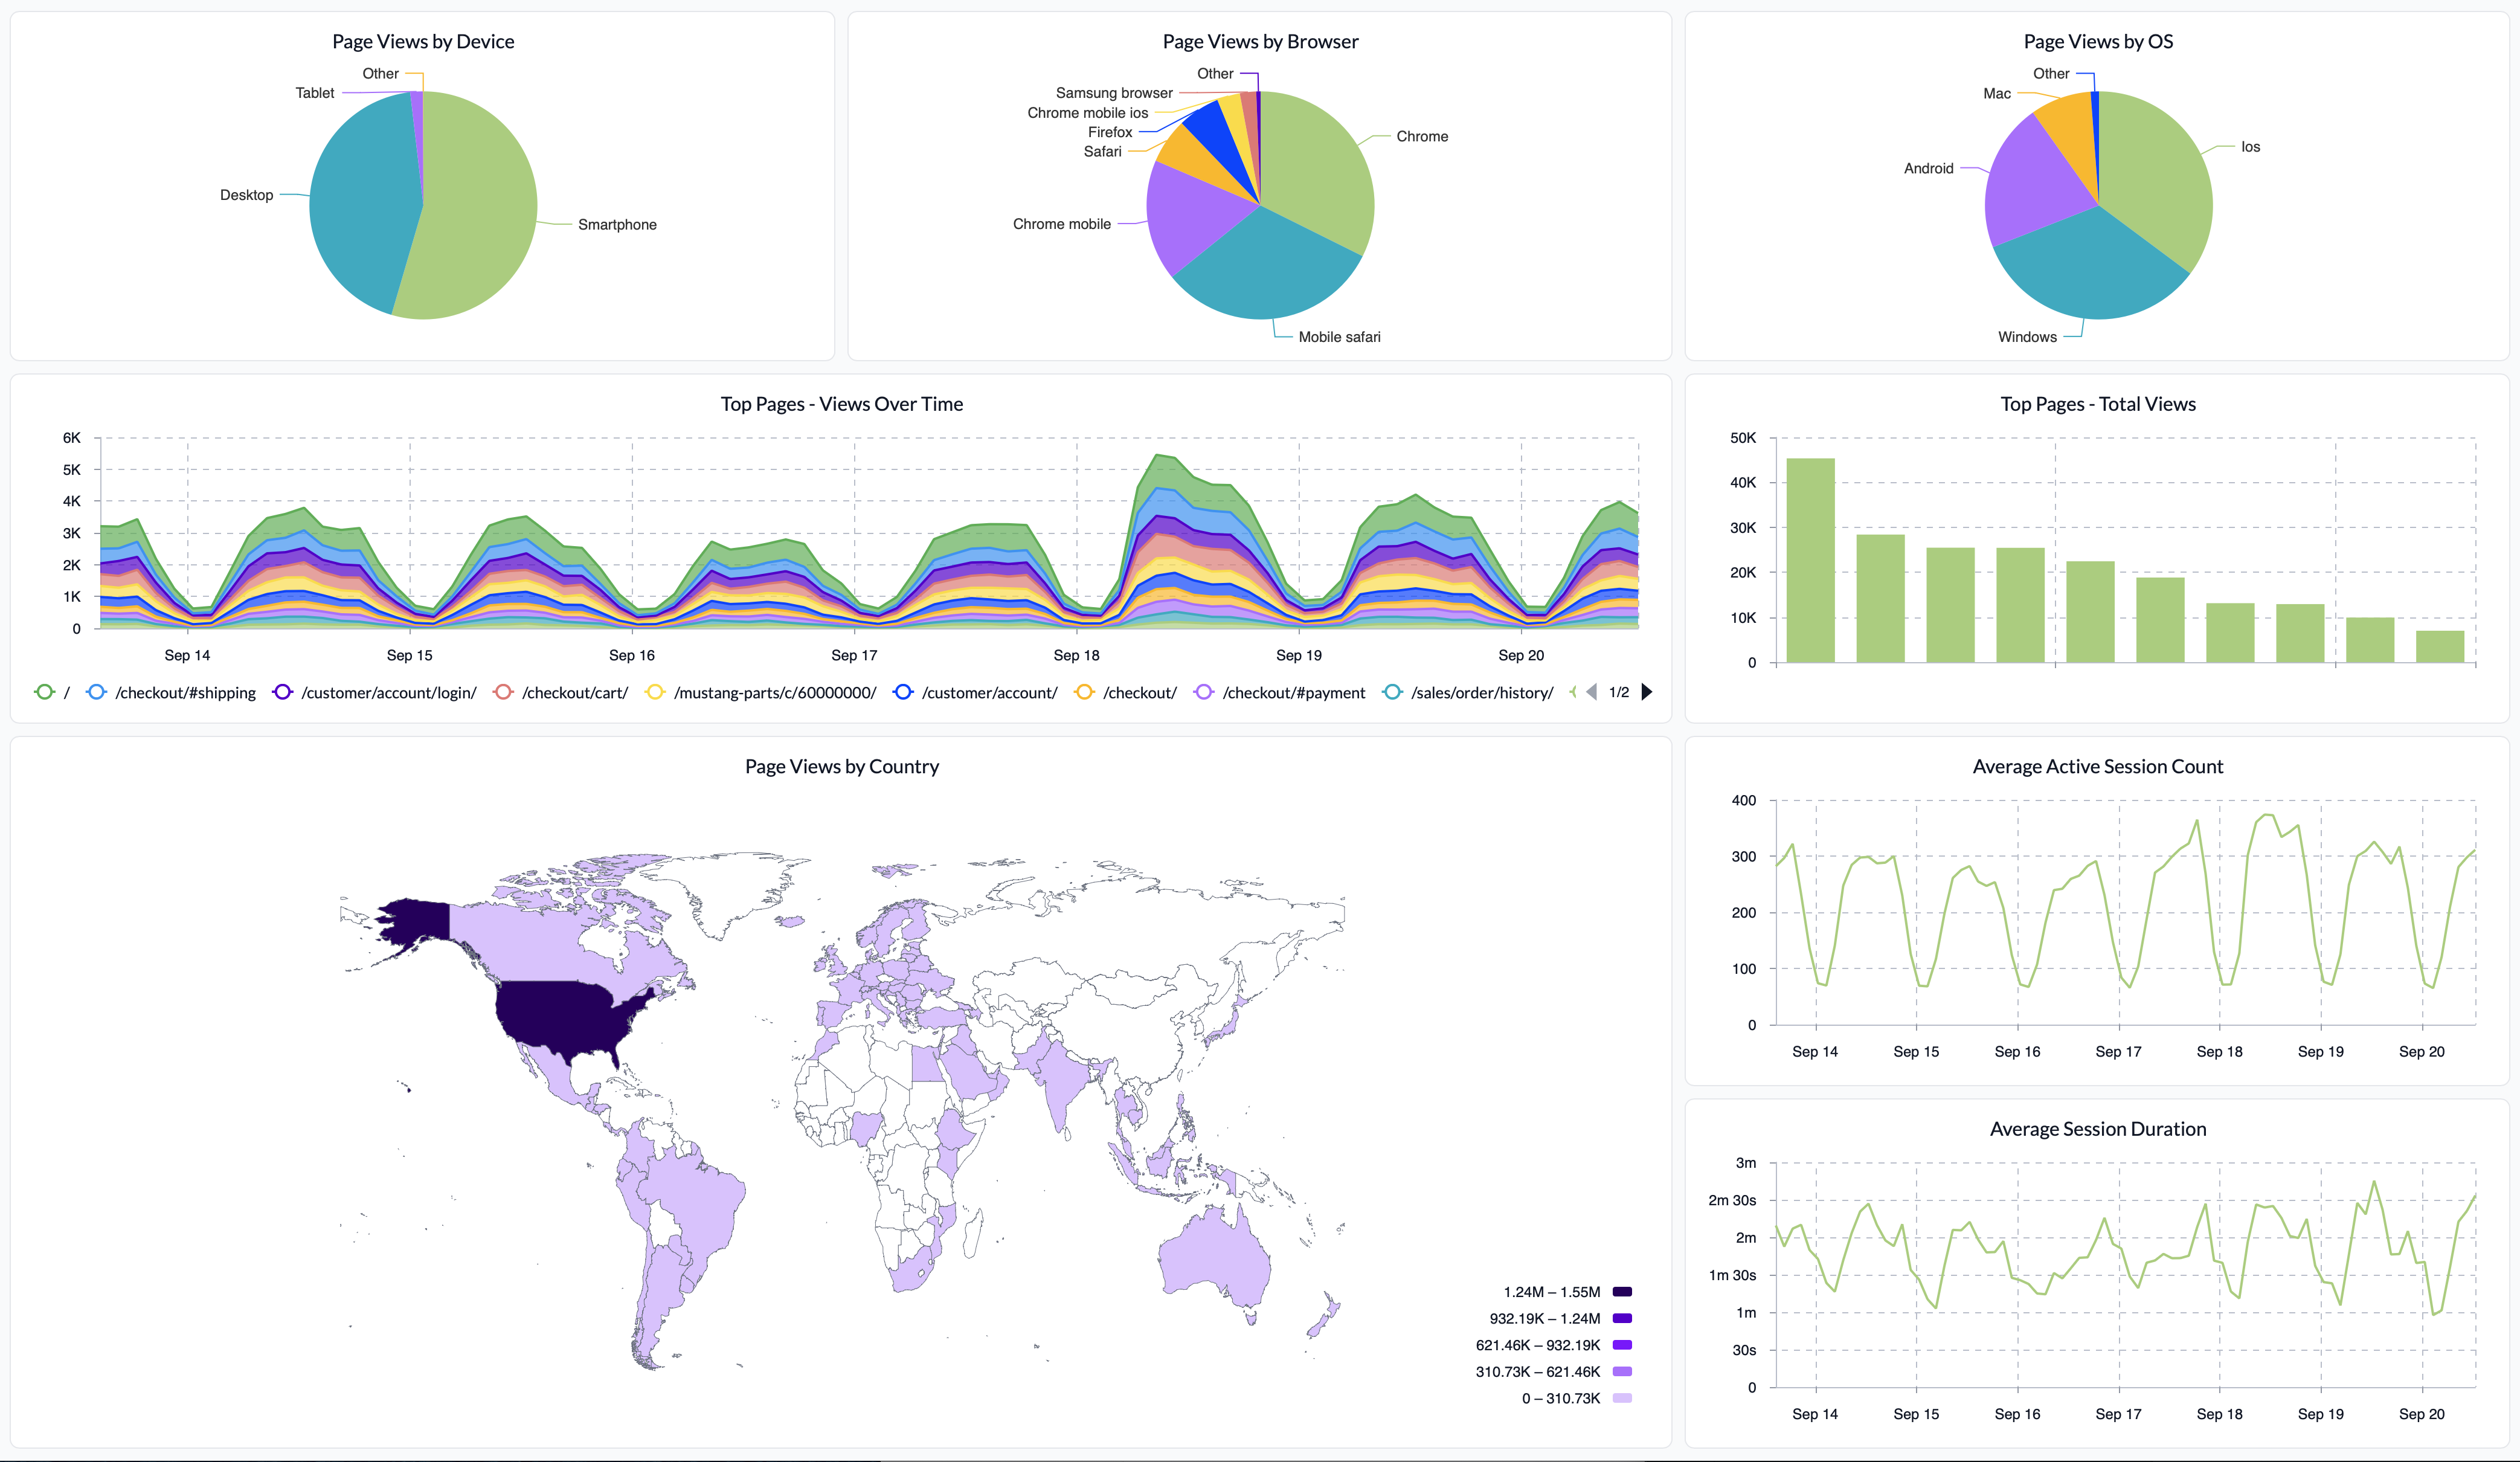
The User analytics dashboard tells the story of who your users are, where they are and what hardware and software they are using to access your site. It allows you to determine how long users spend on your site and which pages are the most popular. This information paints a picture of your users that can directly inform your marketing campaigns and platform optimization decisions.
Traffic monitoring
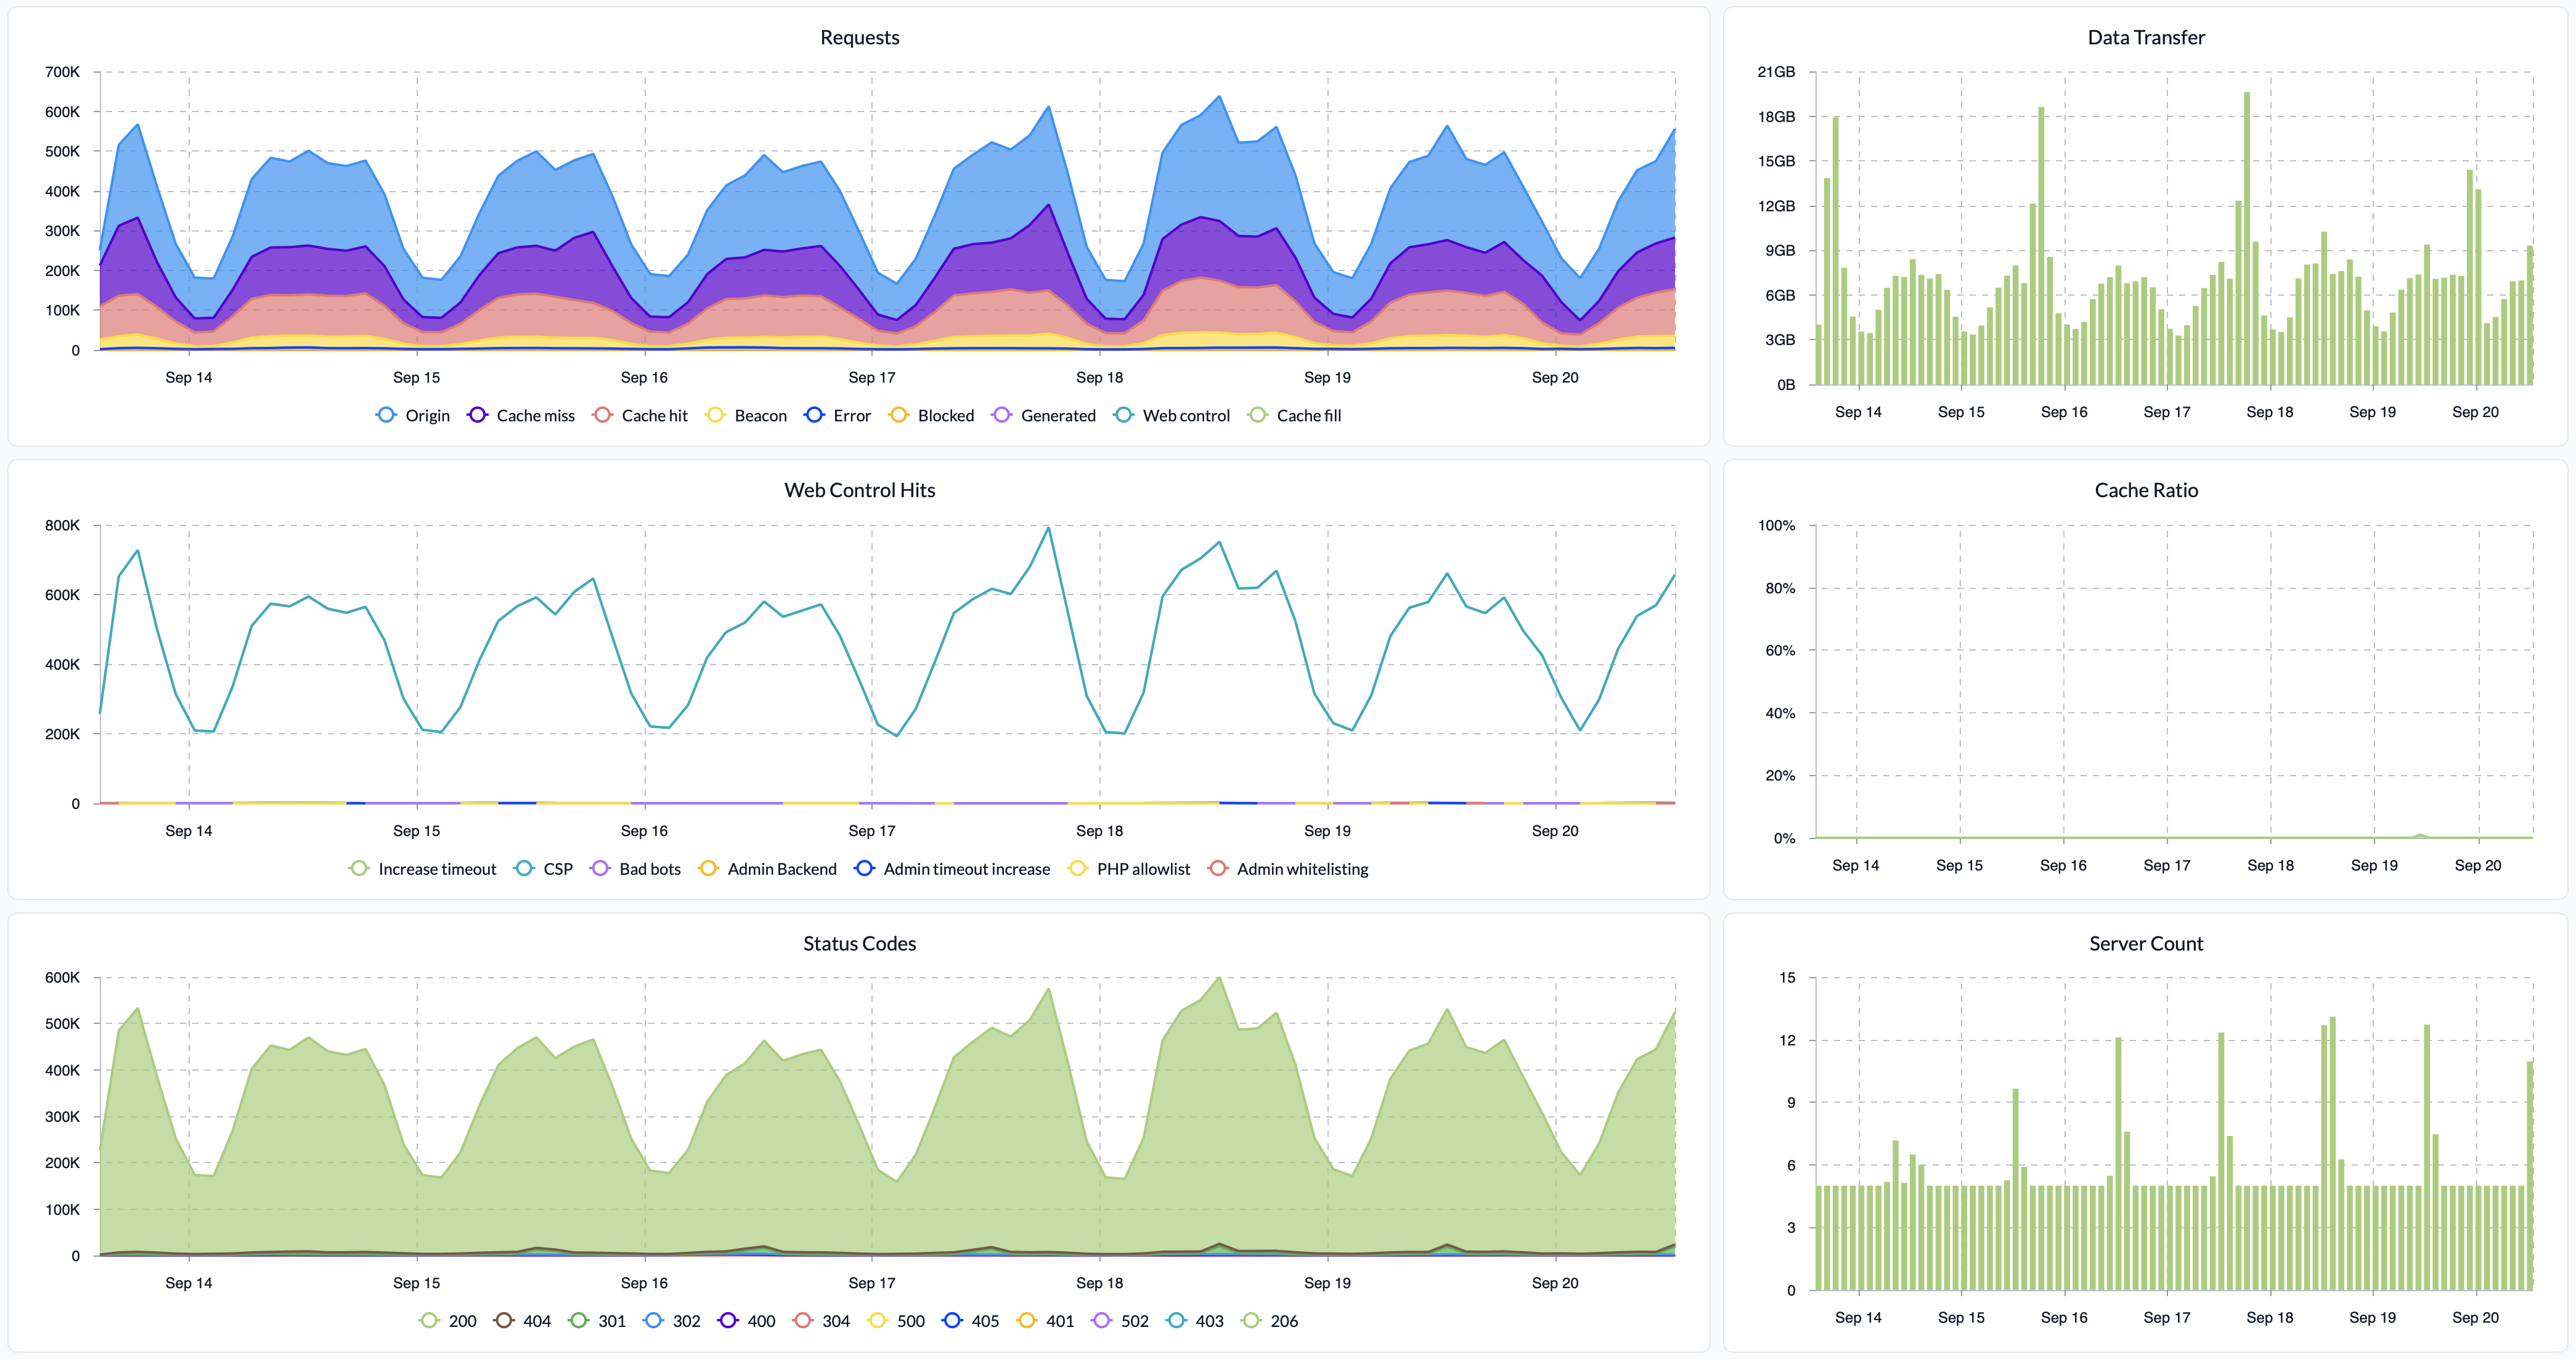
The Traffic monitoring dashboard describes the size of your infrastructure, how it is processing your site’s traffic and how much data is egressing from it. What parts of your infrastructure are responding to your traffic, how they generate responses and what web controls are most active are also reported.
Security insights
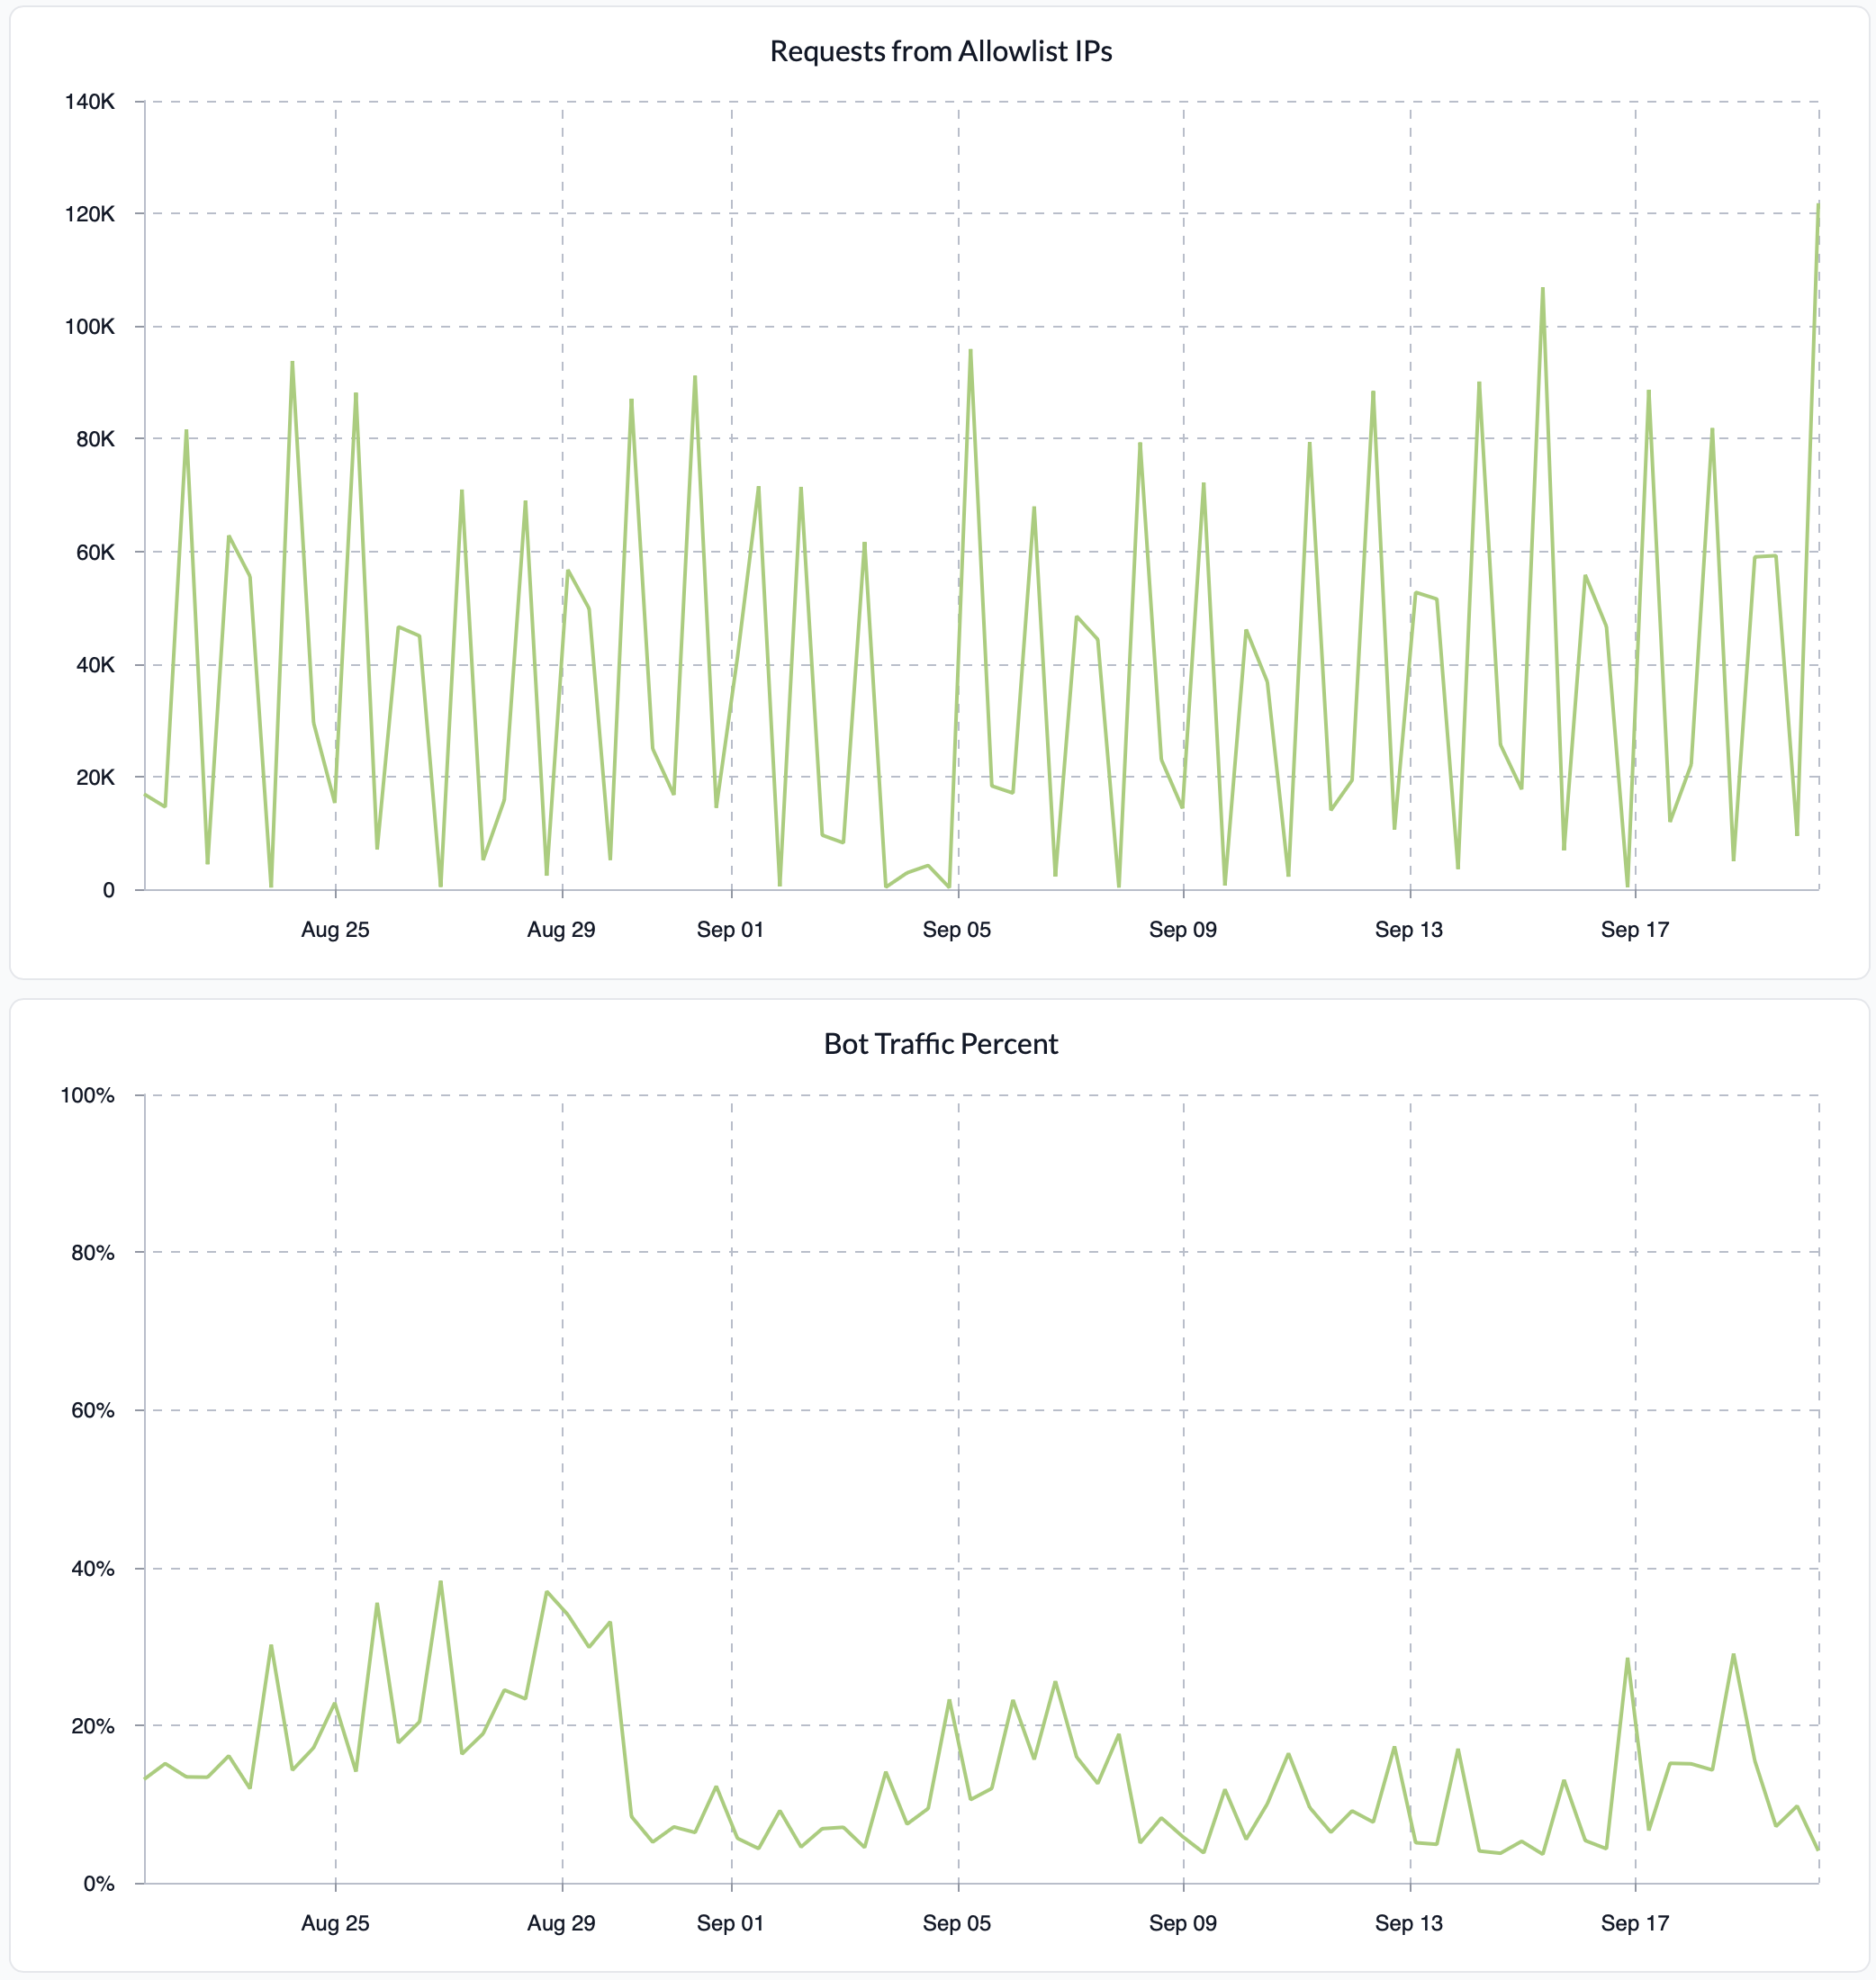
The Security insights dashboard reports the amount of site traffic originating from your address sets, including the application’s allowlist and blocklist. It also reports what percentage of your site’s traffic comes from bots.
Store performance
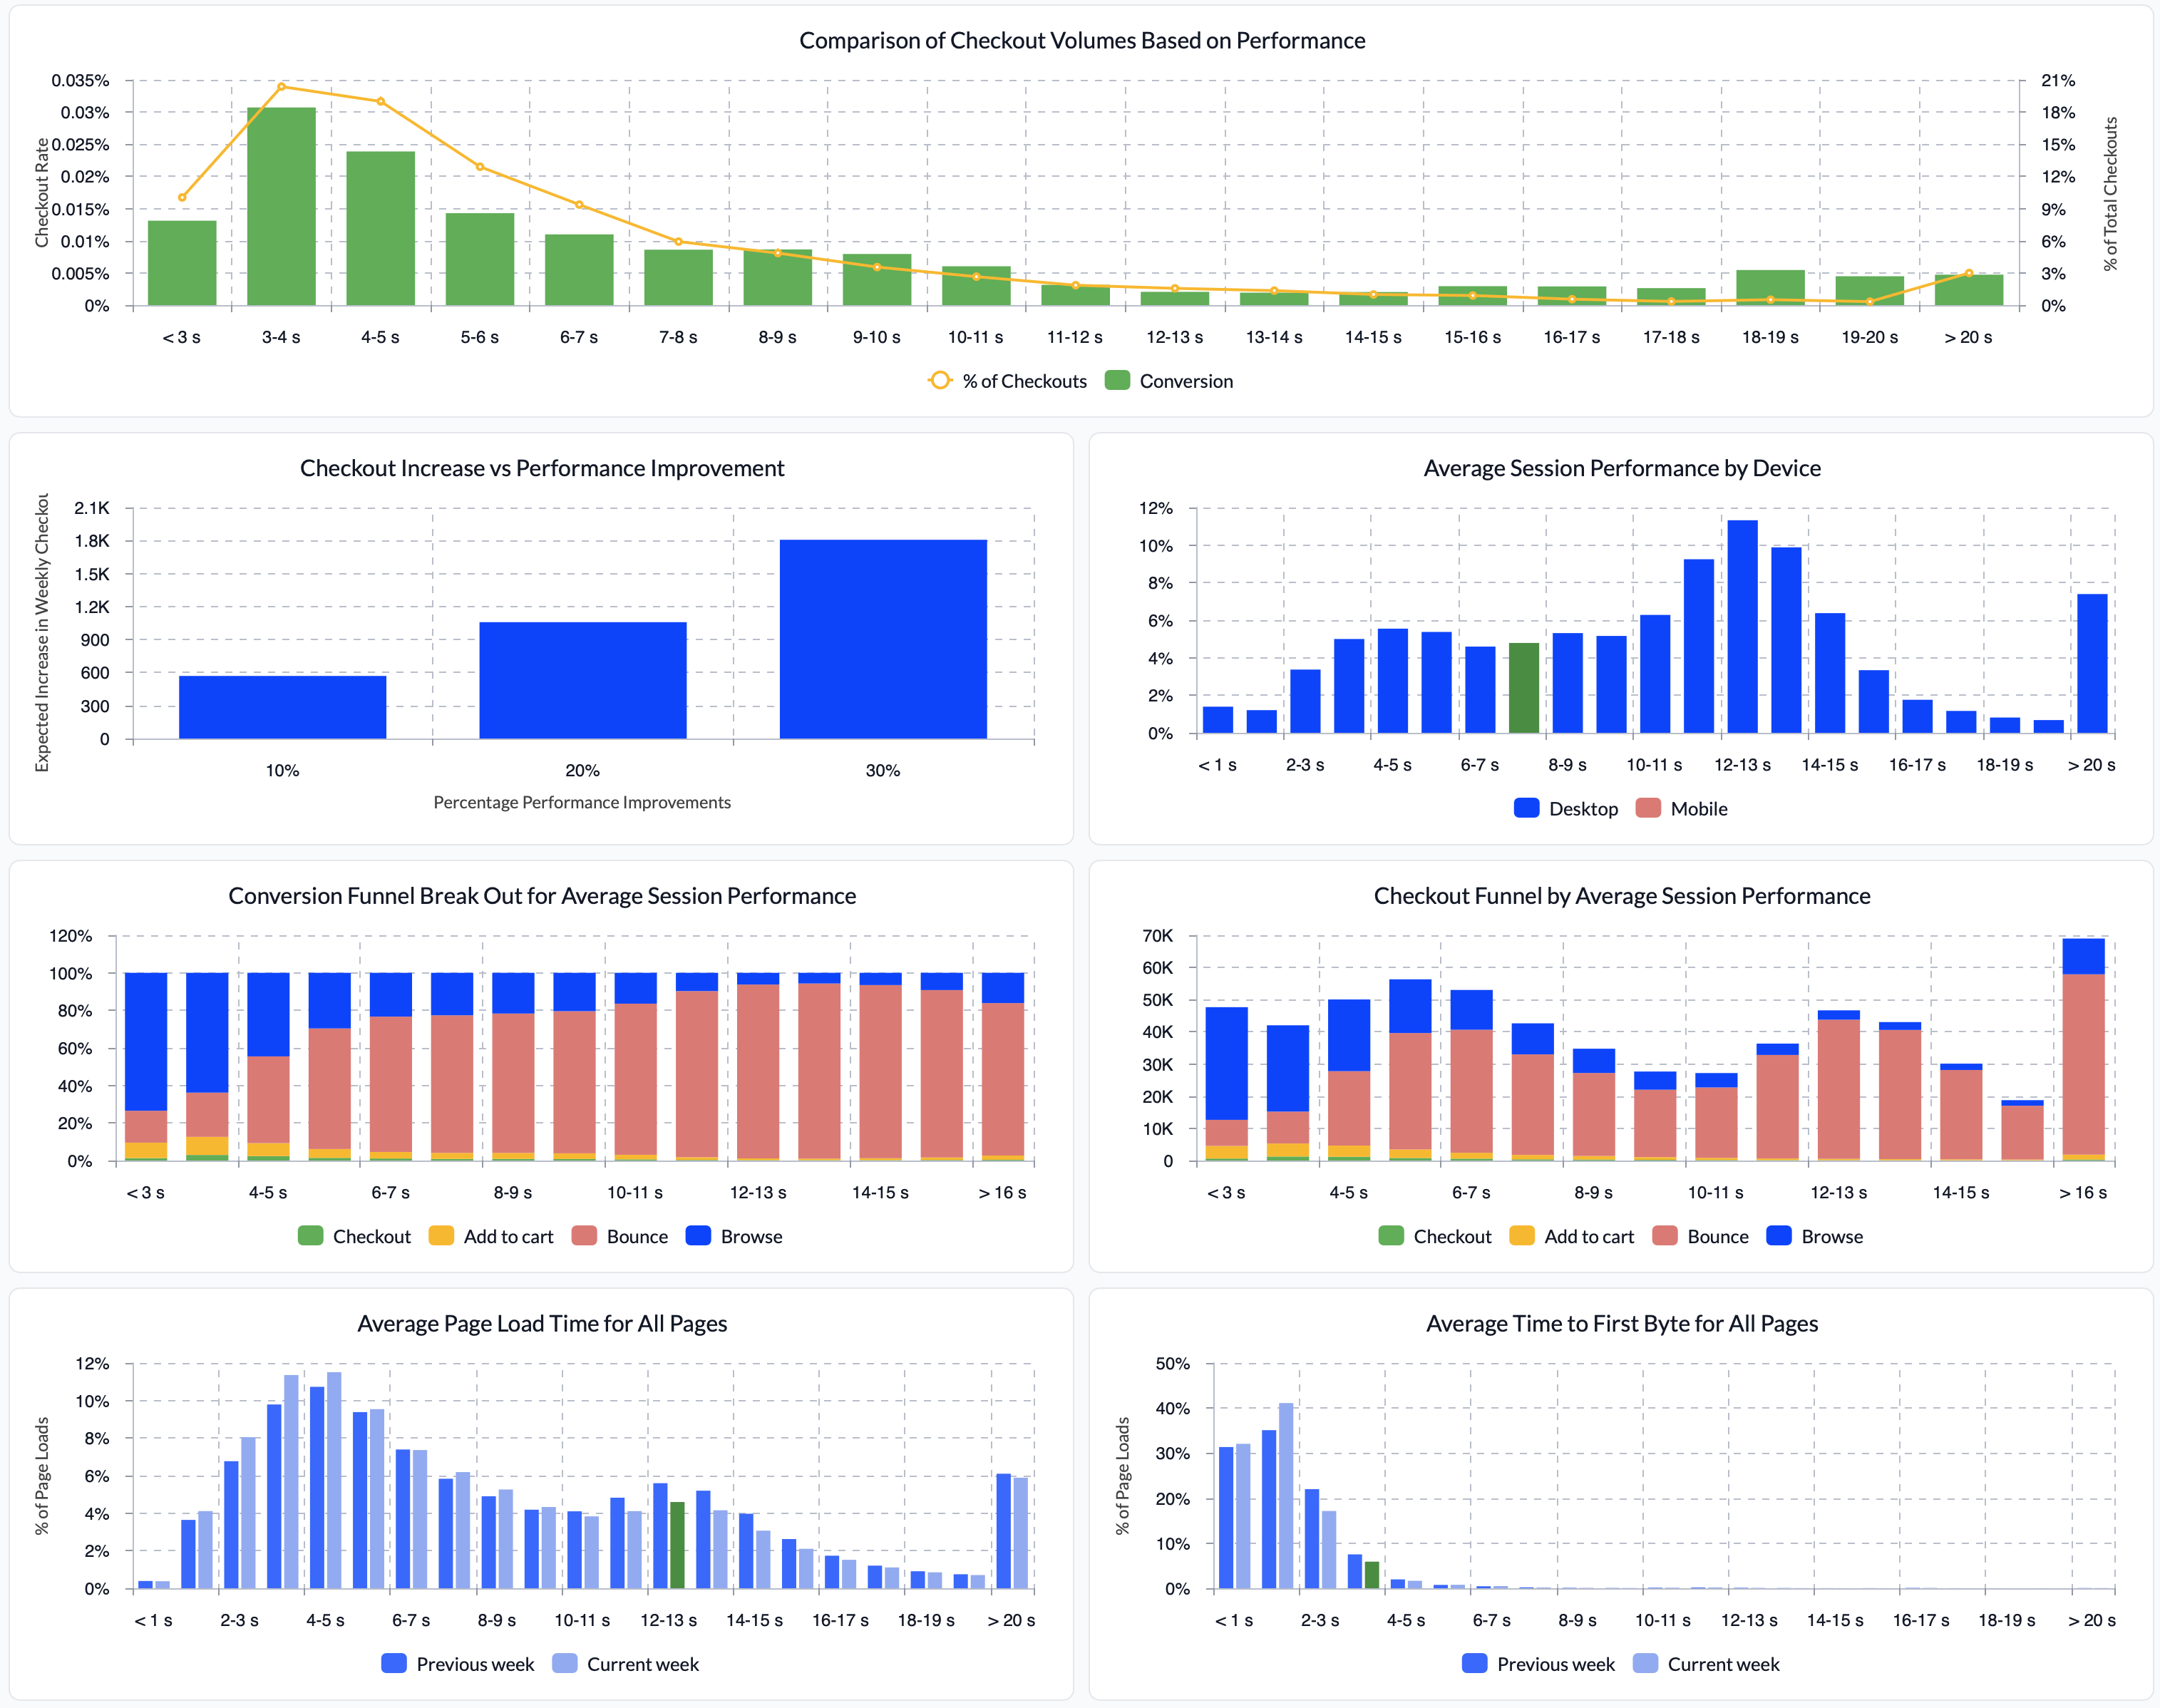
The Store performance dashboard tells the story of how your conversion funnel is affected by a user’s average page load time.
Note:
This dashboard is only available on applications with Webscale real user monitoring (RUM) enabled. With the proper Webscale plan, this can be configured by your Support representative.Each of your user’s sessions are categorized as one of the following types:
- Bounce: the user visited exactly one page of your site and did not return.
- Browse: the user visited multiple parts of your site but did not add any items to their cart or checkout.
- Add to cart: the user added items to their cart but did not checkout.
- Checkout: the user’s session included a checkout.
Session labeling
Because each store’s add to cart and checkout operations are unique, it is necessary for you to describe what each look like. These descriptions can be configured within your account in one of two places:
- In a request labeler. Labelers should be preferred when these operations can be differentiated based solely on request or pageview log attributes. Labelers should also be used if details of the response are relevant.
- In your application’s web controls. Web controls should be preferred if HTTP cookies, headers or the request body must be examined to identify the operation. The ‘Matches filter’ web control condition triggers when parts of the incoming request match a user-defined filter. At the moment, it can apply the filter to a request’s query parameters, formdata or JSON body. Filter’s follow the same format as Traffic Viewer, including an attribute, operator and value. Values should always be strings when matching a query parameter or formdata body. For more information, refer to the web control documentation.
It is possible to use both application web controls and request labelers in conjunction if the request body needs examined and the details of the response are relevant. For example, a web control may label a request based on contents of the body and the labeler may label based on the existence of the label applied by the web control.
Warning:
The labelsadd-to-cart and checkout are reserved for use in the Store performance dashboard. Only use these two labels exactly as they appear here when identifying these operations.
Note:
Any session including both an add to cart and checkout will be categorized as a checkout.Feedback
Was this page helpful?
Glad to hear it! Have any more feedback? Please share it here.
Sorry to hear that. Have any more feedback? Please share it here.