Viewing Reports
You can access reports on your system through the main Reports page, including usage and performance information.
The Outbound data transfer report presents a consolidated view of the amount of outbound data transferred for your account and applications. Outbound data transfer, measured in gigabytes (GB), consists of responses from Webscale to site user requests.
(The data transfer monitor uses the same information as this report. It tracks data transfer usage for all account applications. You can configure it to generate events when it detects activity that matches or exceeds conditions that you define. This monitor can send email notifications when the events occur.)
If you have the optional application testing feature, you can view the results of your application load tests. For information about these tests, see Application load tests.
Topics
Access the Reports page
The Outbound data transfer report displays on the Reports page. If you have the optional application testing feature, you can access load test results reports through through this page.
To access the Reports page
-
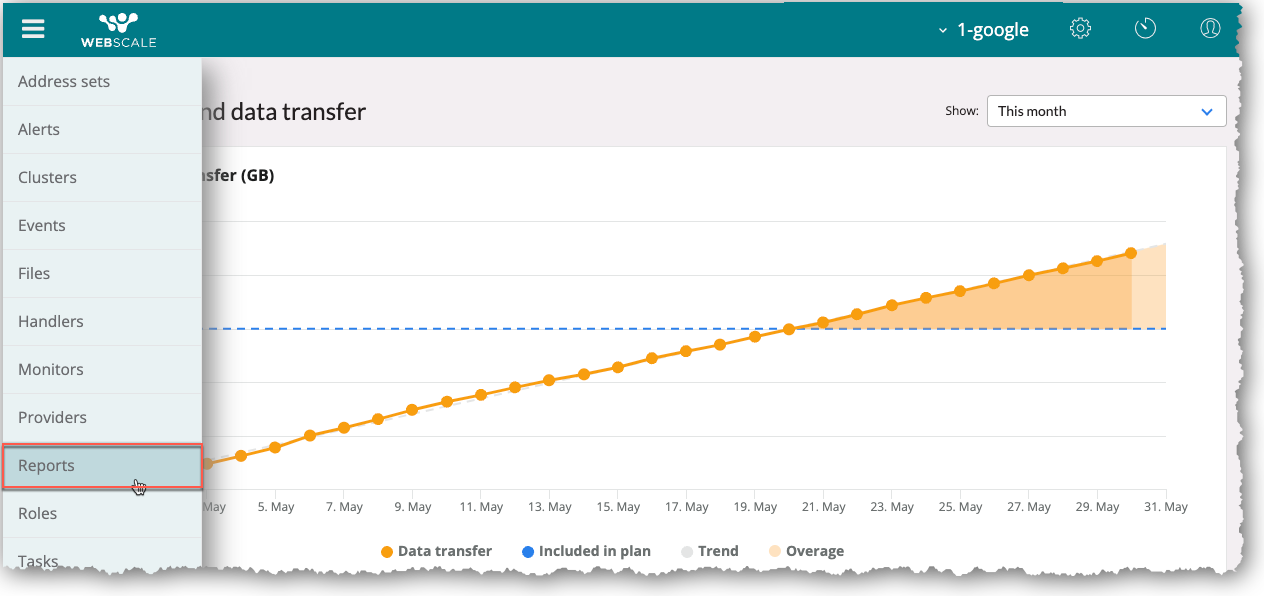
On the Webscale Control Panel page, click the menu icon on the upper-left of the screen.
-
On the sidebar menu, select Reports.
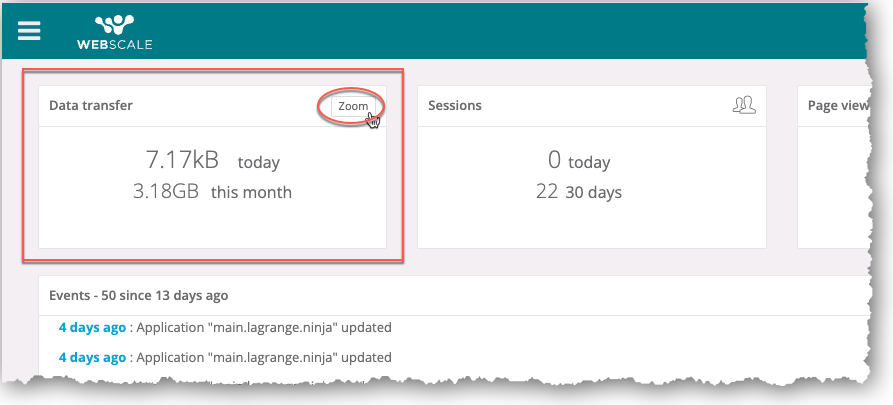
-or-
In the Webscale Control Page page, click Zoom in the Data transfer section at the upper-left of the screen.
Outbound data transfer report
The Outbound data transfer report on the Reports page presents the amount of outbound data that you have used. Based on the data range for the report, other information might display.
You can use this report to identify trends and unexpected shifts regarding your outbound data usage. It consists of a graph and table. A date range selector enables you to specify the time period for the report.
The Outbound data transfer report enables you to view outbound data for your account by:
- Day
- Cumulatively for the month
- Current or last month
- All available data
You can also view daily and monthly amounts of data per application.
Your contract might include a specified monthly amount of data for your plan. By comparing data usage during the current month against the amount of monthly outbound data for your plan, you can help prevent unexpected data transfer overage fees. For help with increasing the amount of data for your plan, contact support.
If your contract does not include monthly data, the user interface will not reference a plan amount or overages.
To view this report, follow the procedure in Access the Reports page.
Note:
The Data transfer section of the Webscale Control Panel page also displays outbound data transfer for the current day and month. The daily information does not display in real-time.Important:
If this report shows a different amount of outbound data included in your plan than the amount in your current contract, contact support.Frequency of updating data
The data for the current day populates the report at midnight GMT on the same day. When you view this month’s report, it will display the actual data for the preceding days of the month but only projected data for the current one.
Webscale uses Greenwich Mean Time (GMT) to determine when it populates the report.
Important:
For the first day of a new month, the report is empty if the current month is selected as the date range. The report displays data transfer retroactively on the second day of the month.Date range selector
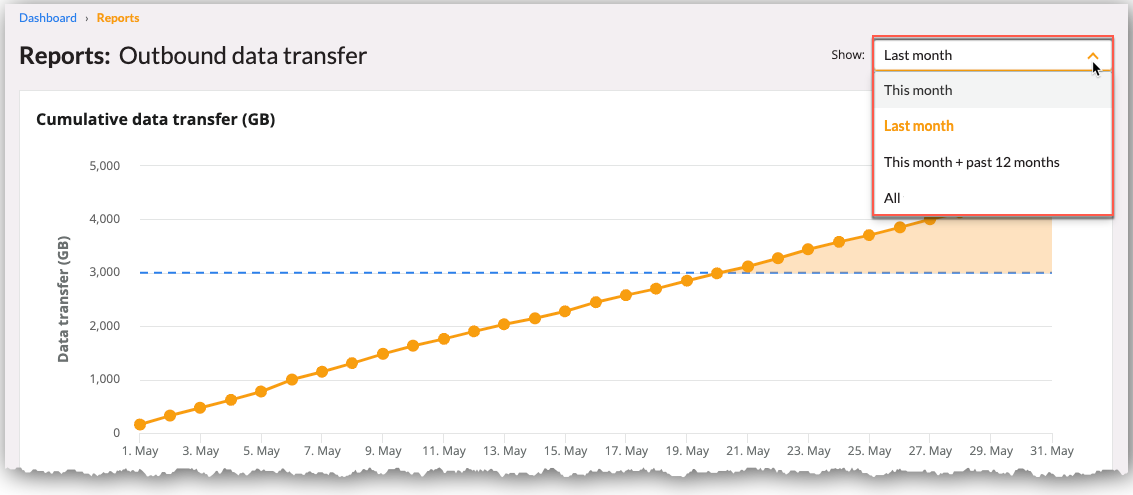
The Show drop-down menu enables you to select a date range that defines the data that displays:
- This month - measured in daily increments
- Last month - measured in daily increments
- This month + past 12 months - measured in monthly increments: Enables you to view data from the same month in the current and previous year (e.g., January 2021 and 2022)
- All - measured in monthly increments: Displays all recorded report data
When you first view the Outbound data transfer report, the data for the current month displays. Afterwards, the selected date range is the same as it was at the end of your previous session.
Note:
Recorded outbound data transfer information is available for accounts starting from November 2020.
Data broken down by application is available starting from March 2022.
To change the data range
In the Show drop-down menu, select another date range option.
The report information for the specified date range displays.
Data transfer graph
The title of the data transfer graph and type of information that displays change according to the specified date range. For the This month and Last month options, the graph is named Cumulative data transfer. It populates with cumulative daily data for the current or previous month.
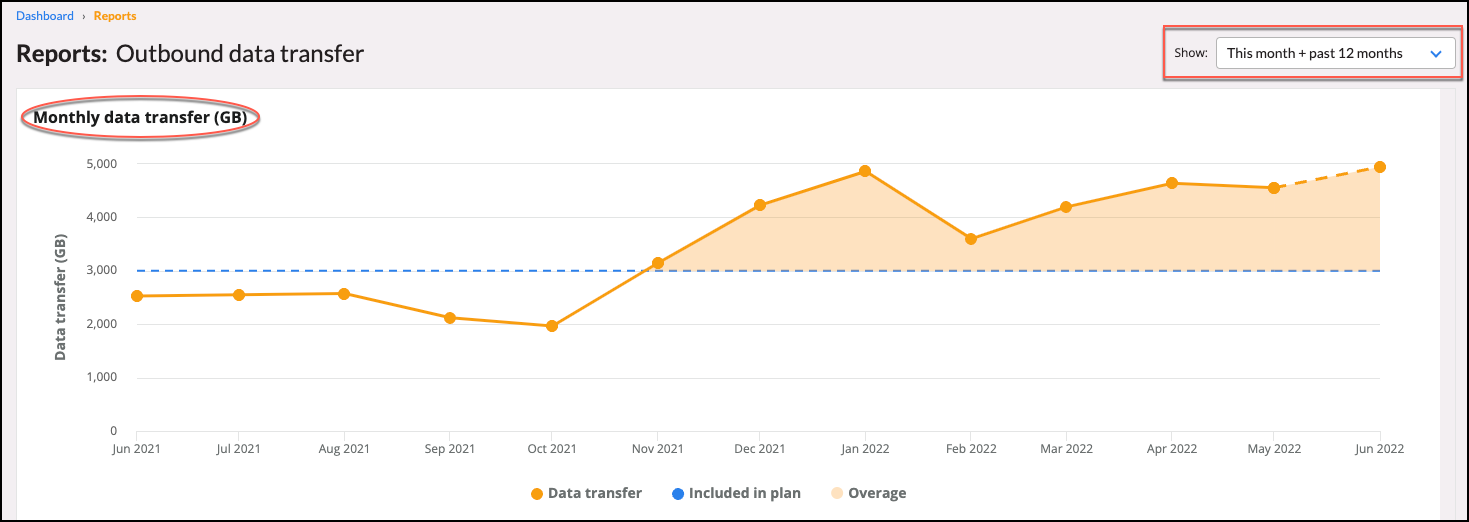
For the This month + past 12 months and All options, the graph is named Monthly data transfer. It measures data by the month.
Current and previous month graph
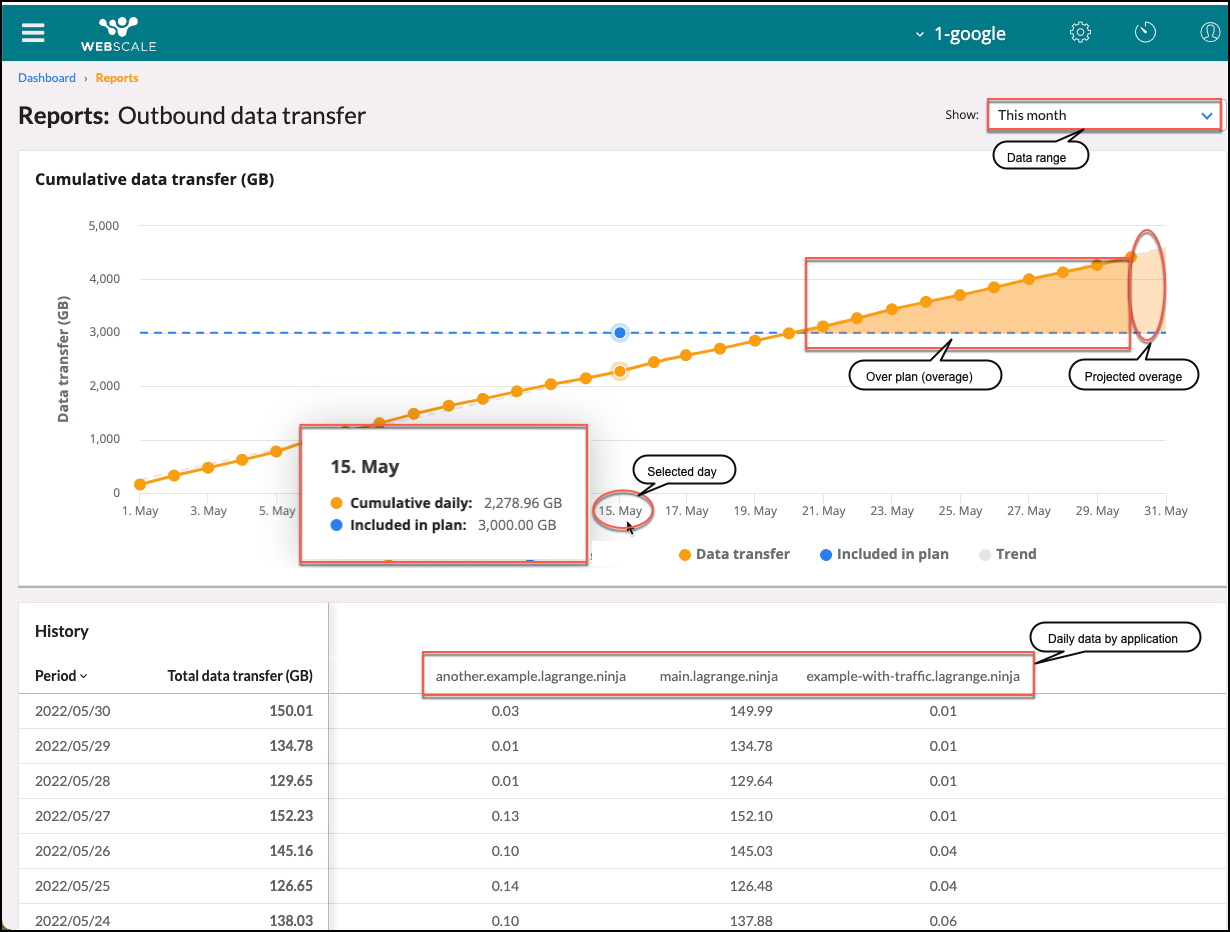
If you choose to view the data for the current or previous month, the data transfer line presents cumulative data for the month in daily increments.
When you hover over a date, a tooltip shows the amount of data that you have used. If you are viewing data for the current month and the trend line is forecasting an overage, it also includes the projected cumulative overage for each day. If you are viewing past data, the tooltip includes the actual cumulative overage amounts.
Current month graph
For only the current month graph, a dotted trend line does not appear until the third day of the month. It projects date usage for the rest of the month based on prior usage for the month.
If your contract stipulates a data transfer amount and the current usage or trend lines surpass the Included in plan horizontal line, the graph will indicate this actual or projected overage with orange shading for an overage and lighter orange shading for projected overage. In addition to cumulative current and projected data, the tooltip for the current month can include the plan data amount and dates for actual or projected overage.

Graph for the other data ranges
The graph that displays for the This month + past 12 months and All date range options presents outbound data by the month and not cumulatively. There is a trend line for the current month but nor for previous ones. If your plan includes data, the graph and tooltip reflect it.
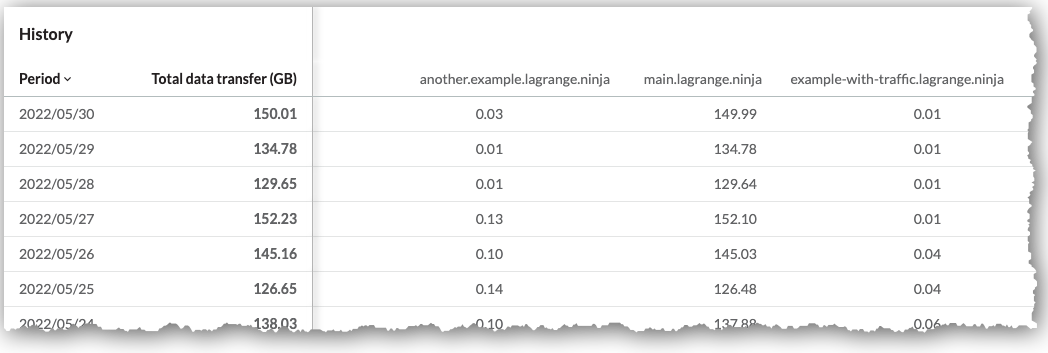
History table
If you choose to view the outbound data for the current or previous month, the left section of the History table presents the total amount of data for each day of the month for your account. If you select the This month + past 12 months and All date range options, the left section presents the total amount of account data by month.
The History table does not present cumulative data.
The right section of the table breaks down the data by application.
Application load tests
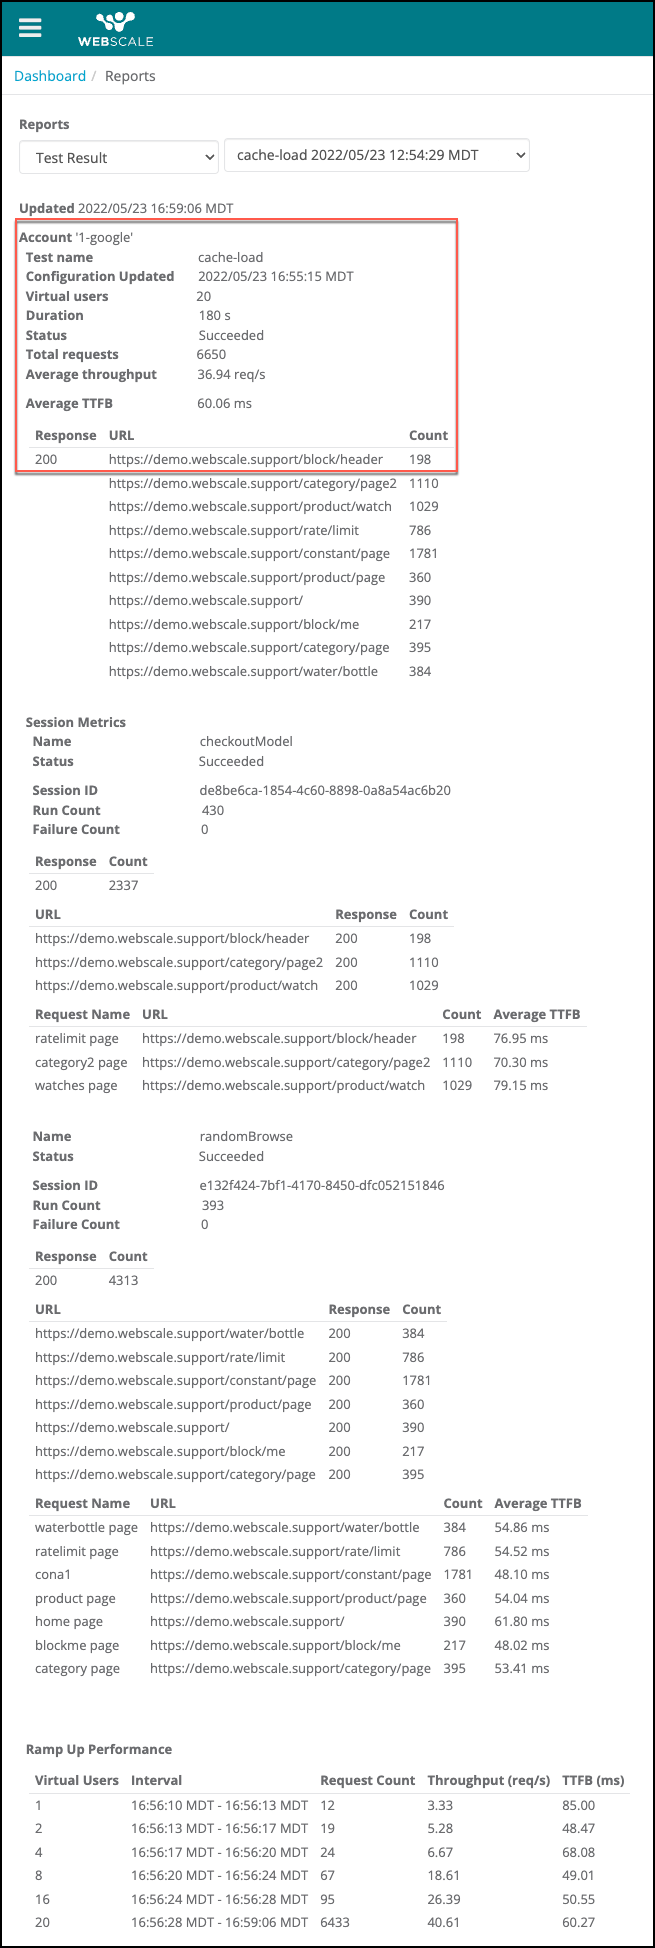
The optional application testing feature enables you to run customized load tests to measure the performance of your system. Every time that you run a test, Webscale generates a report with the test results.
A reports page that is dedicated to load test results enables you to view all test results reports. You can access test reports through the main Reports page and Application testing page.
For more information about the application testing feature and accessing test results reports through the Application testing page, see Testing Your Application.
Note:
The user interface for this feature, including the Application testing entry on the accounts sidebar menu, only displays if this feature is enabled.To view an application load test
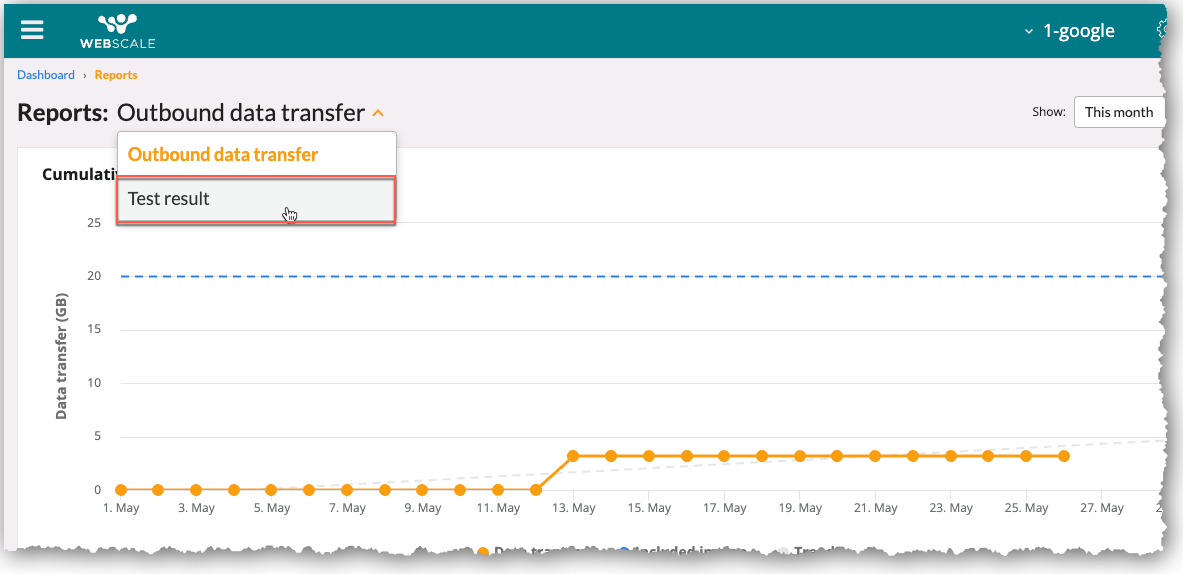
-
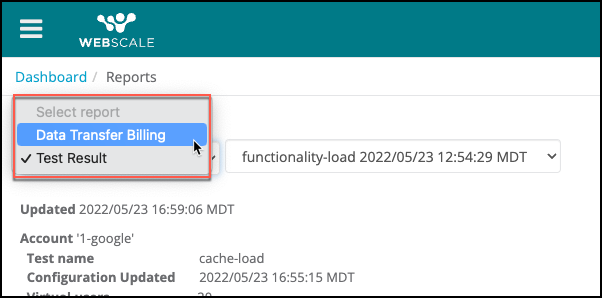
In the main Reports page, select the Test result option in the Reports drop-down menu.
-
In the test results reports page, select a report in the right drop-down menu under Reports.
The report displays.
-
To return to the main Reports page, you can select Outbound data transfer in the left drop-down menu under Reports.

Further Reading
Have questions not answered here? Please Contact Support to get more help.
Feedback
Was this page helpful?
Glad to hear it! Have any more feedback? Please share it here.
Sorry to hear that. Have any more feedback? Please share it here.