Using Traffic Viewer
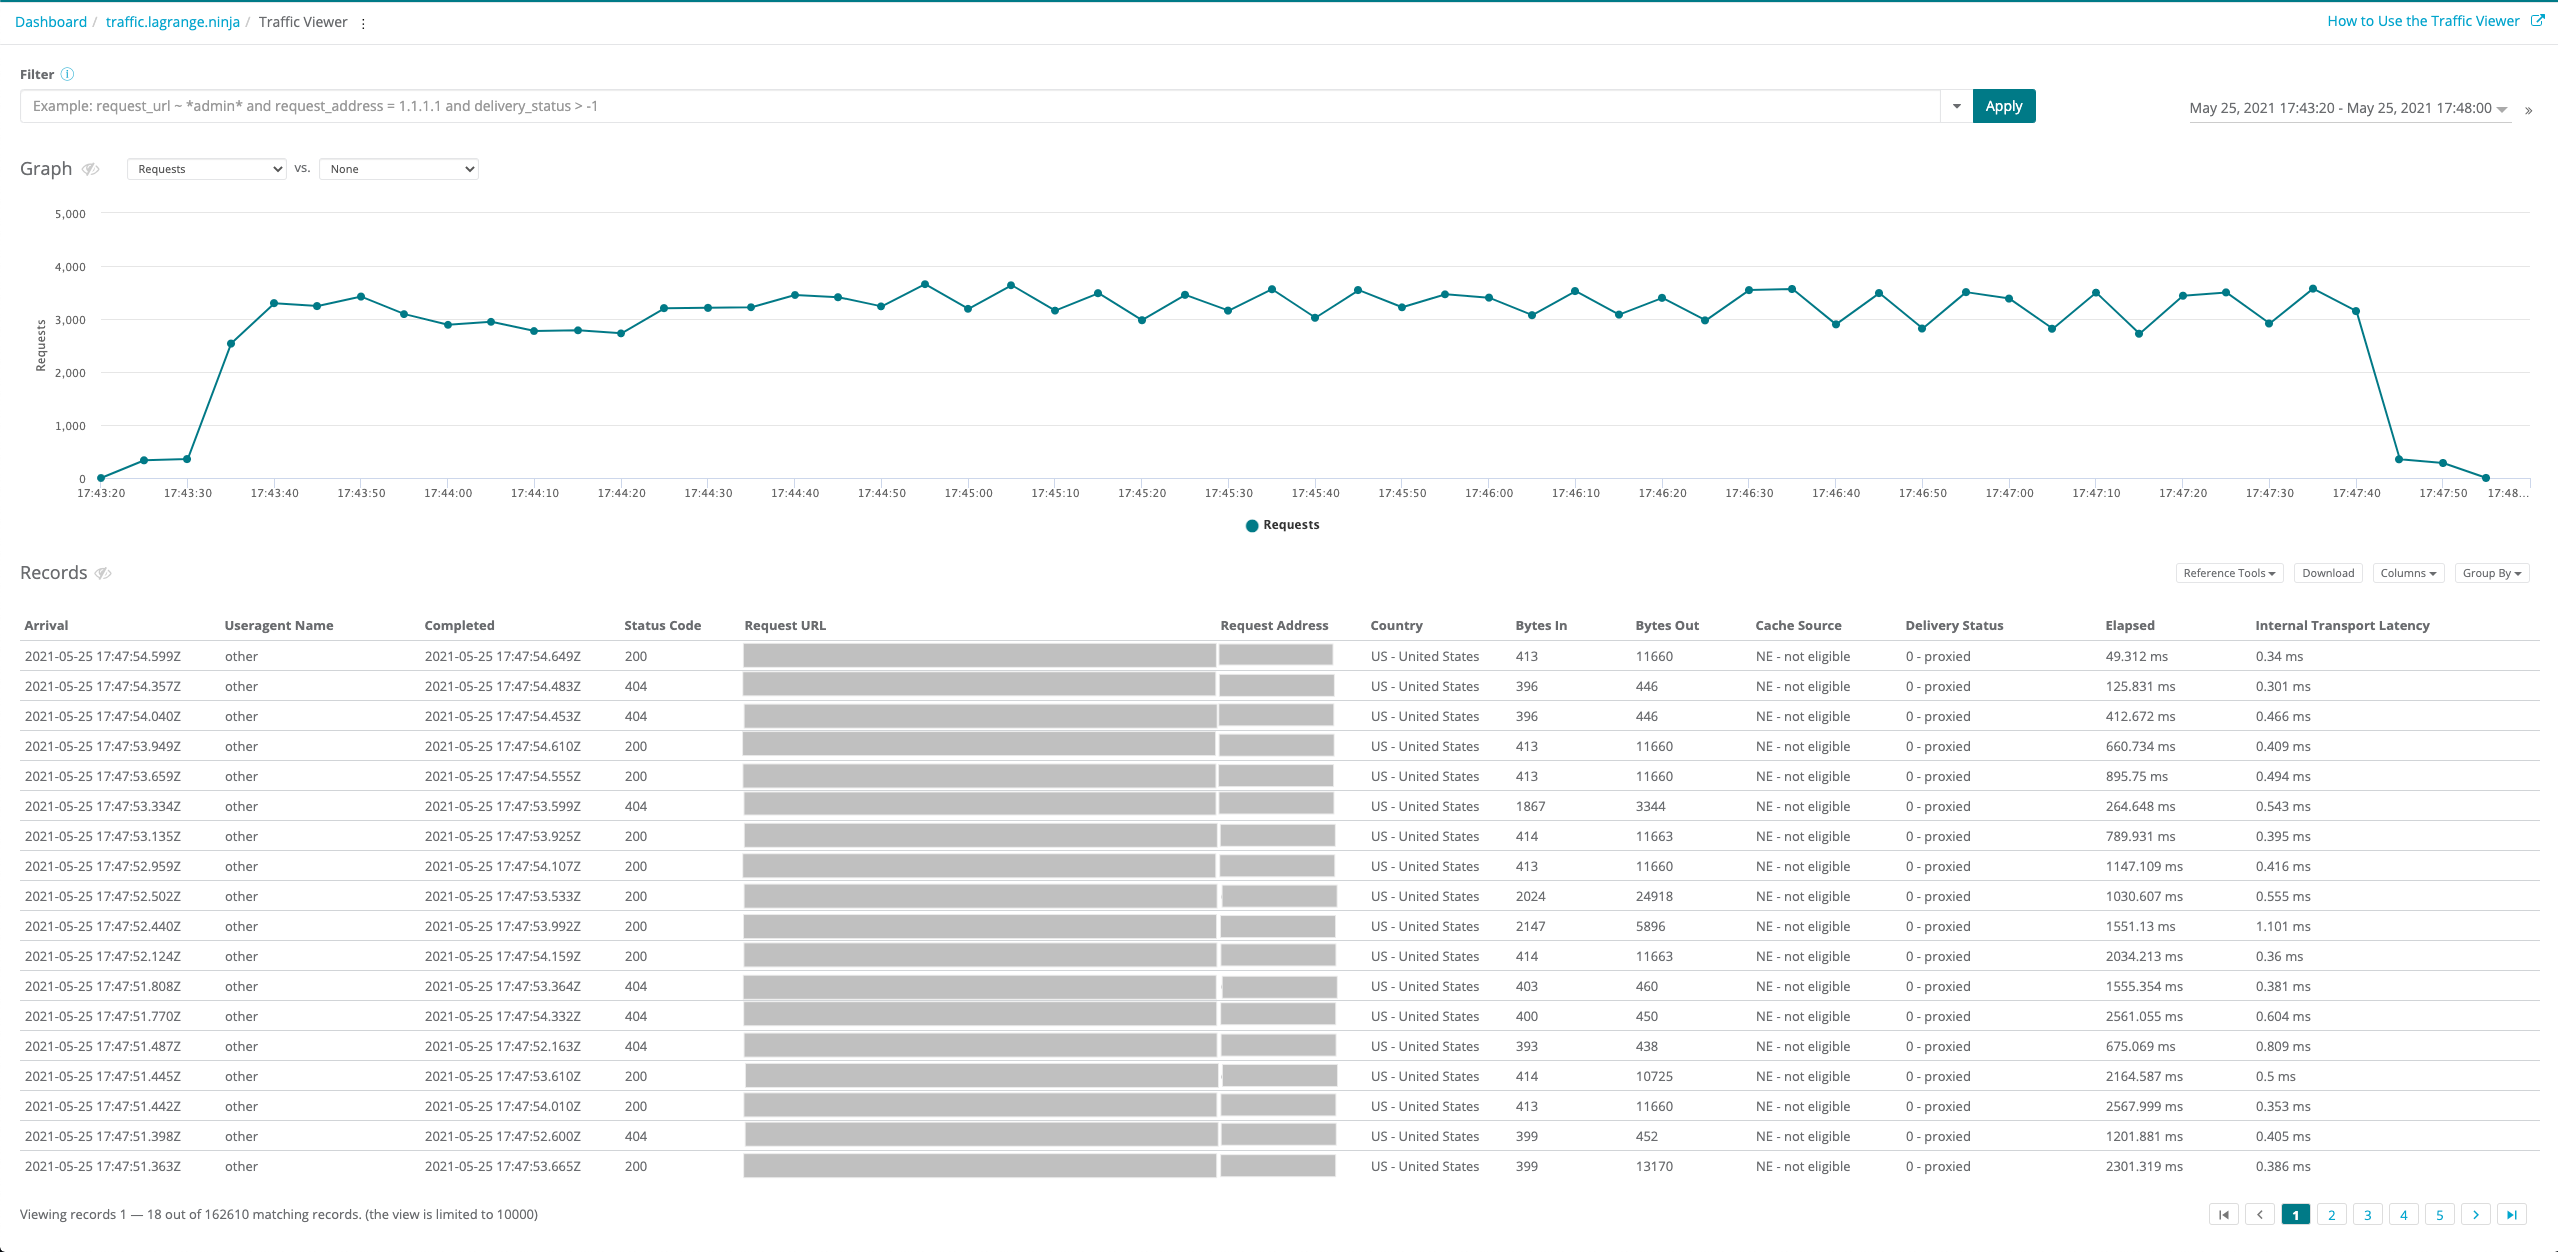
Traffic Viewer presents logs information about your application network traffic. You can drill down to specific logs based on logs type and date range. Additionally, you can filter results based on specific attribute values. The viewer for Traffic Viewer functions as the wrapper for all four types: CDN, CSP reports, Pageview, and Proxy (also known as the Traffic viewer logs type). As such, it displays views for them through a dedicated page for each logs type.
After your logs search has produced results, you can view the logs in two formats: detailed and group. With the detailed format, complete information for the logs displays in the Records table. With the group view, only the logs that match the selected group type display. When you move from one format to the other, the logs view in the current format retains the same query criteria as the previous one.
The search filter strongly influences the results. Through the filter history, you can easily duplicate previous queries. The history includes the past 20 filters that you have used during your current session. You can return to a previous search by selecting the corresponding filter and specifying other search criteria.
To access Traffic Viewer
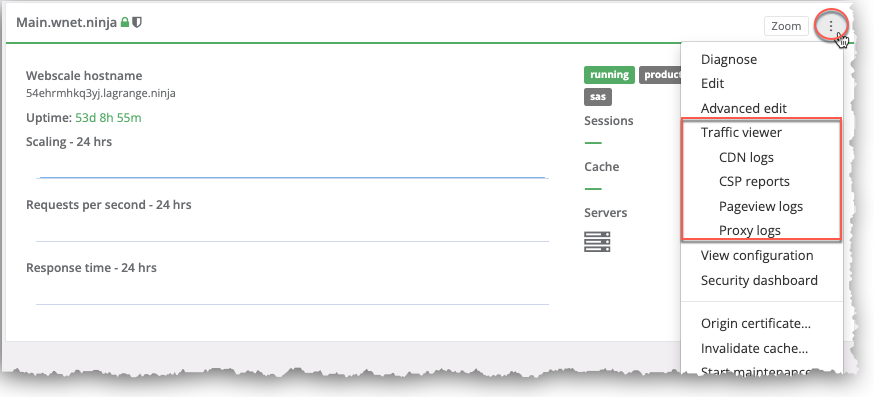
Click the three vertical dots menu icon on the upper right corner of the application box and select a logs type option from the Traffic Viewer sub-menu.
-or-
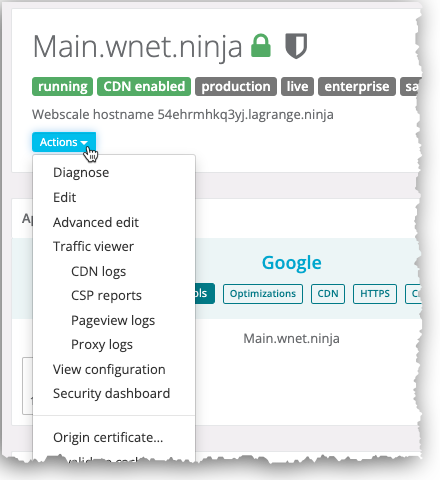
On your application page, click the Actions menu icon and select a logs type option from the Traffic Viewer sub-menu.
On the menu that appears, click any one of the options.
Logs type selection
In the logs viewer for a logs type, you can select another type to see its viewer by using the three vertical dots menu above the Filter field. Open the menu by clicking the three vertical dots icon. The navigation path adjacent to the icon indicates the current viewer type.
Filter builder
You can create a filter that defines the logs query through the Filter field. Filtering is a useful way to view only the data that interests you. For example, a filter allows you to match all or part of a log, or match specific parts of logs to other logs. When you transition to another view, the last view’s filter bar stays at the state you left it in. Obtain values from the records and add them to the filter without triggering a new view. Alternatively, take values from the summary table and trigger a new view that adds that value to the filter. For more detailed instructions, see Filter Building in the Traffic Viewer.
Time selection
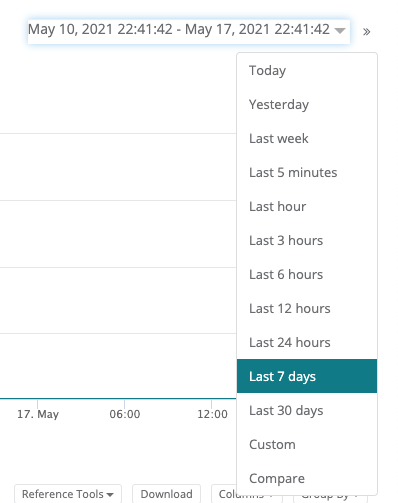
The time selection is independent of the logs views; in other words, whatever time you have selected persists from view to view. The time picker permits you to select any time range within the last month.
The available time ranges within the last month are shown below.
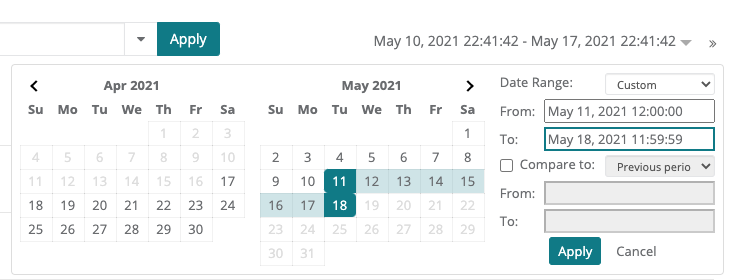
You can also provide your own start and end times within the last month by selecting the “Custom” option. A customized start time can be provided in the “From” input field and a customized end time can be provided in the “To” input field.
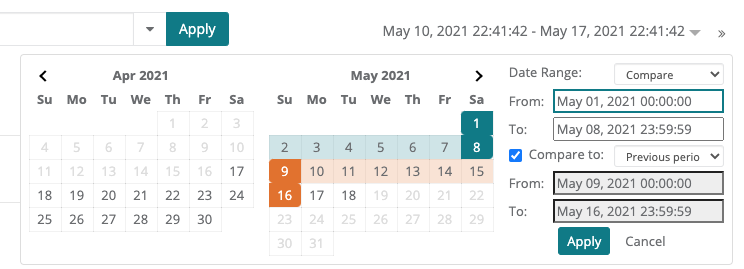
You can compare logs in two time ranges within the last month. This can be achieved by either selecting the “Compare” option in the time picker dropdown or by selecting the “Custom” option in the dropdown followed by checking the “Compare To” box right below the “To” input field for the first time range.
Graph
The graph plots data points for each log type or metric provided based on the time range selected. The x-axis represents the time period and the y-axis represents the metric.
Metrics
The metrics and their meanings are described below for the corresponding data end points.
| Metrics | Explanation |
|---|---|
| Bytes In Per Second | Bytes received by the Webscale proxy per second, including the HTTP request line and headers. |
| Bytes Out Per Second | Bytes sent out by the Webscale proxy per second, including the headers. |
| Requests | The total number of records for the corresponding logs type. |
| Requests per second | Number of records for the corresponding logs type per second. |
| Page Load Time | The time taken to load a page for an application when a pagespeed-based beacon was used. |
| Pageviews | The total number of page loads for an application. |
| Active Requests | The number of requests that were successfully processed. |
| Cluster Server Count | The number of active servers across all clusters. |
| Rejected Requests | The number of requests that were dropped and therefore not processed. There are two ways a request could be rejected:
|
| Static Server Count | The number of active servers that are outside any cluster. |
| Suspended Requests | The number of requests that are waiting to be processed. If the new incoming request crosses the limit to the number of active requests that can be processed in one batch, the request will be queued. |
For the meanings of the metrics listed below, see Building Filters in Traffic Viewer.
- Bytes In
- Bytes Out
- Internal Latency (
internal_transport_latency) - Queue Latency
- Response Time (
elapsed) - Server Latency
- Threats
- Traffic TTFB (
ttfb) - DOM Content Loaded
- DOM Interactive
- Pageview Elapsed
- First Contentful Paint
- Largest Contentful Paint
- Pageview TTFB
- Ready State Interactive
Compare time ranges
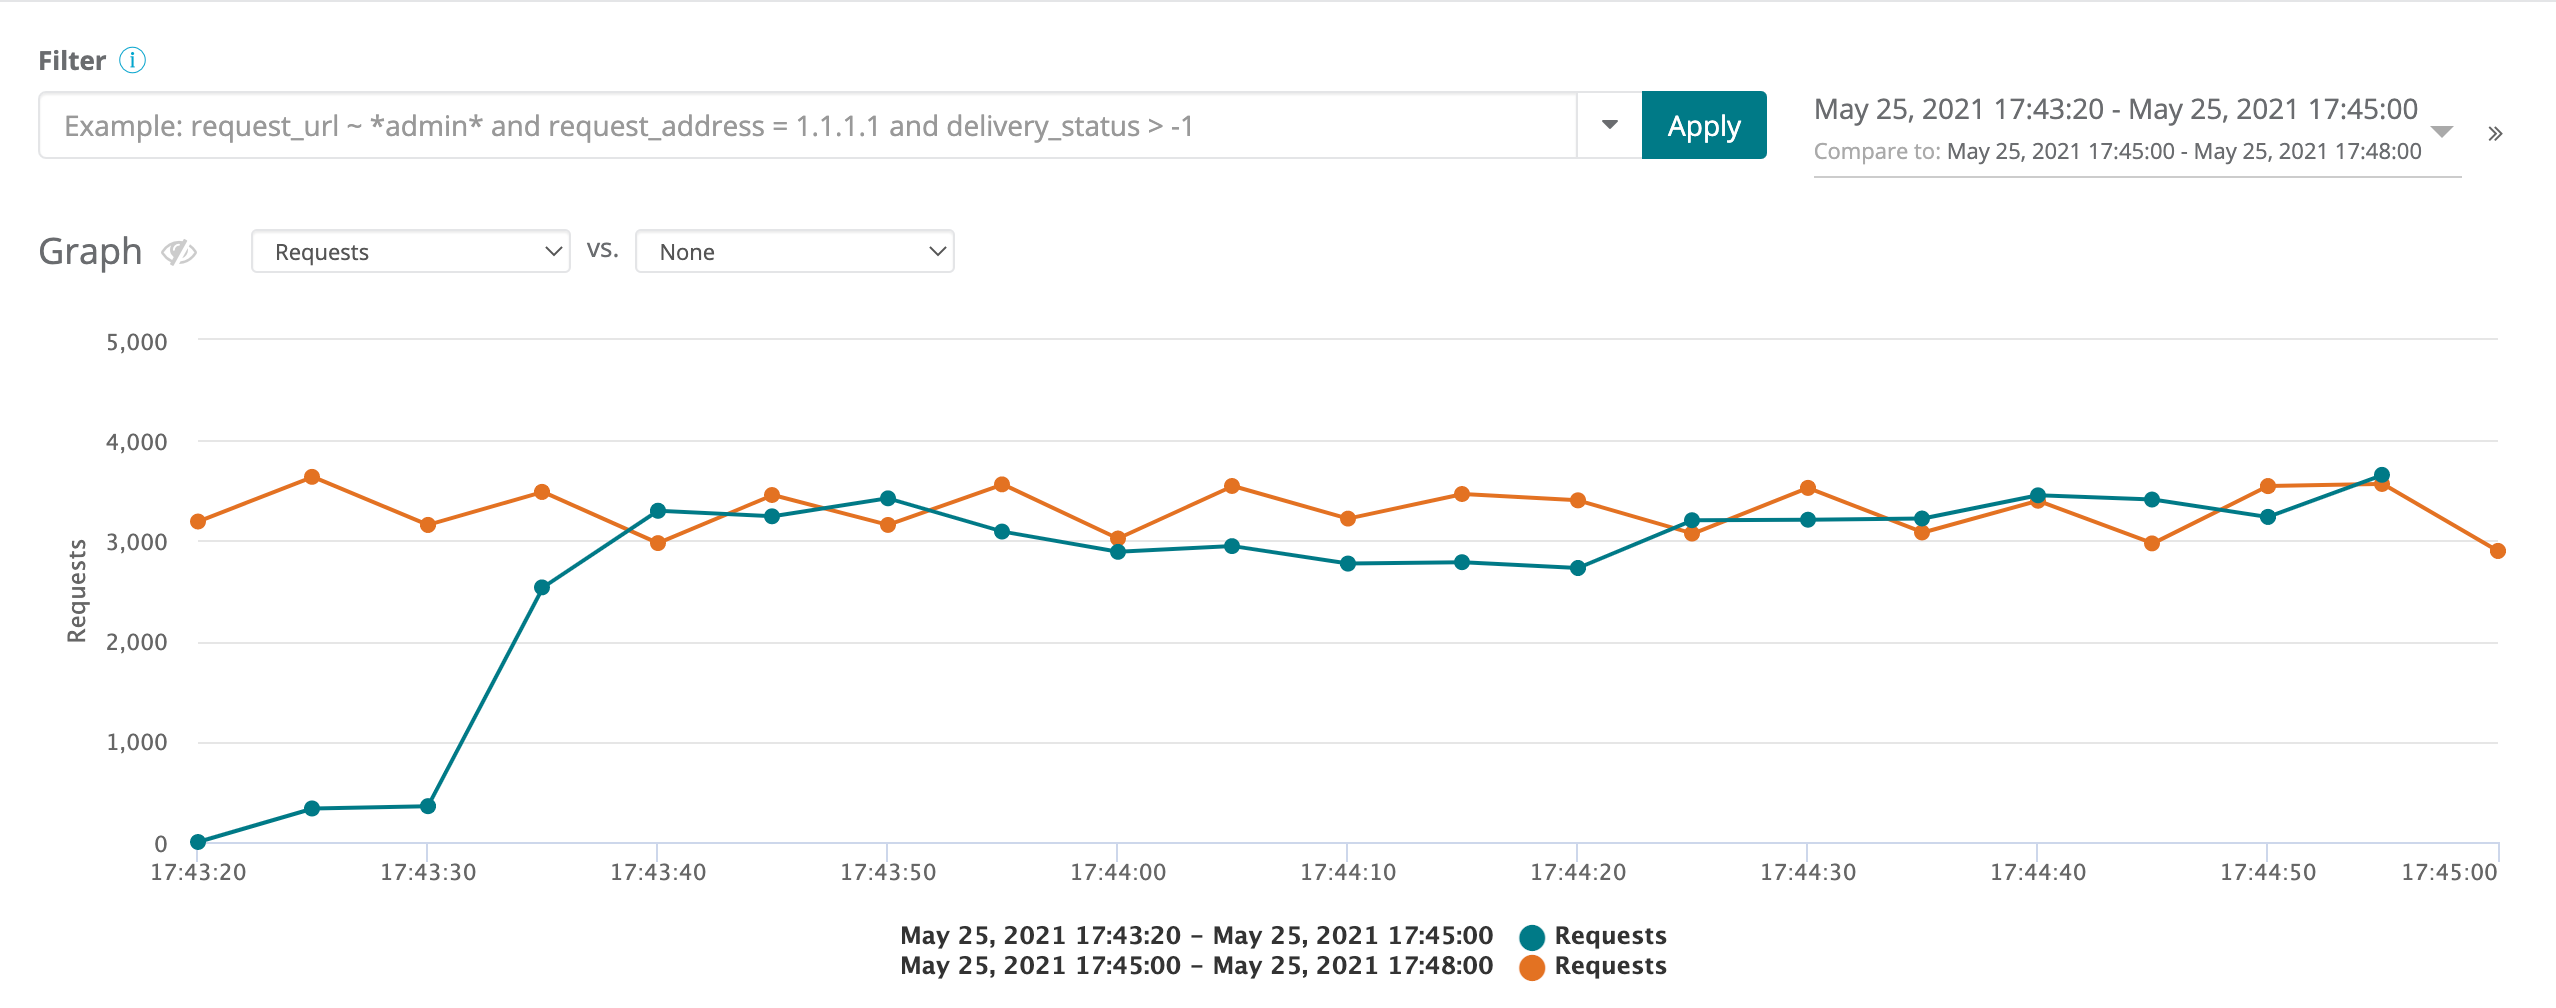
When comparing time ranges, the graph is updated accordingly. For the single metric, there are two graph lines with each assigned a color to differentiate their data points for their respective time periods.
Compare metrics
Metrics can be compared by selecting a metric in each of the two select drop-down menus present right next to the “Graph” label below the filter input. When comparing metrics, the graph is updated accordingly. Two graph lines are plotted corresponding to the two metrics with each assigned a color to differentiate their data points. The metrics are placed on the left and right y-axes. The metric on the left y-axis corresponds to the metric selected in the first dropdown (from left to right) and the metric on the right y-axis corresponds to the metric selected in the second dropdown.
Group graph
In the group view, when the icon ( ) is clicked, the first five groups from the table have their data points plotted for the chosen metric and is displayed in the graph as five colored lines. You can also add a sixth group to the graph. The maximum number of groups you can view is six.
Graph usability
The graph offers a couple of usability features - drag and hover.
Drag
You can click and drag the graph either to the left or right.
- Clicking and dragging to the left sets your time range forward.
- Clicking and dragging to the right sets your time range backwards. Dragging to the left or right always maintains the same time period between start and end times.
Hover
You can either hover over a data point in the graph or over the graph legend.
- Hovering over a data point displays a popover showing the values for the corresponding metrics.
- The graph legend contains all the displayed metrics. It tells you what type of metric corresponds to which line on the time graph. Hovering over a legend metric point highlights the corresponding line in the graph.
Hovering over a data point in the graph
The popover displays the values for the corresponding metrics. The metrics are identified by the color of the graph line they’re associated with.
Hovering over an item in the graph legend
Hovering over an item in the legend highlights the corresponding graph line.
Records view
Use the records view to inspect records on a more detailed and individual level. Access all available information about any specific record here.
Toggle visibility
Click the icon ( ) positioned to the right of the Records label above the table to display and hide the records.
Reference tools
Click the Reference Tools button to view the list of address sets available in the account the application belongs to. Clicking on any address set will show you its details like its definition and its address entries. You can edit an address set provided you are an account admin and own the address set.
Download records
Click the download button to download all of the logs that fit your current log request.
Columns selector
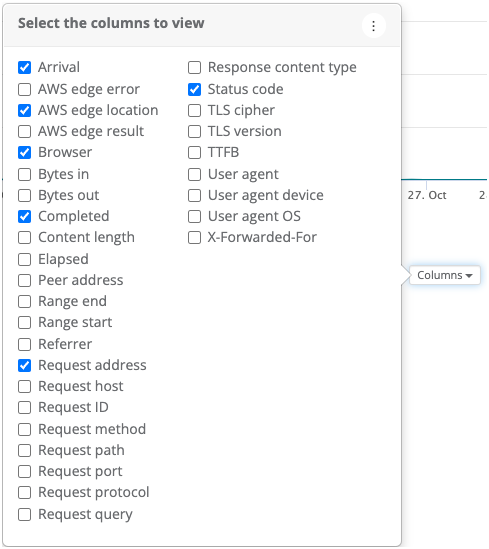
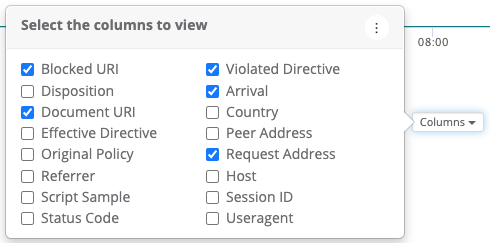
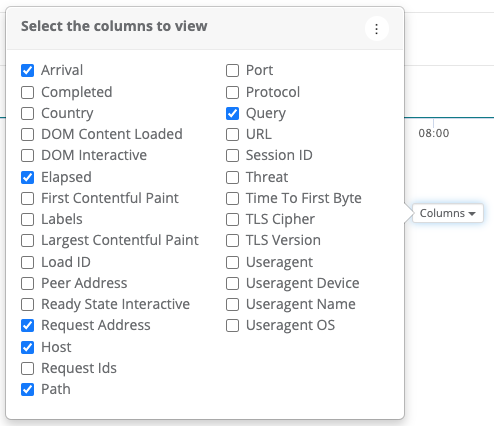
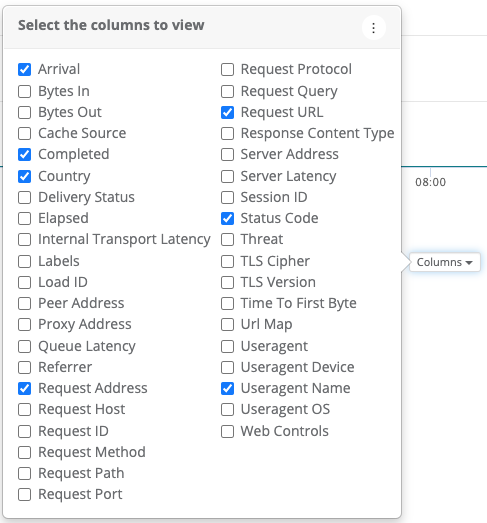
The search results display in columns in the Records table. You can change the default columns of associated information by accessing the columns selector. The columns window of the selector contains all of the attributes for the relevant logs type. When you initially access the columns window, the attributes for the default collection of columns are selected. When you select different attributes, the columns for the associated information exclusively display.
To access the columns window
In the logs view, click Columns in the row of options to the right of the Records table heading.
CDN logs columns selector
The below options are selected by default for the CDN logs viewer.
CSP reports columns selector
The below options are selected by default for the CSP reports viewer.
Pageview logs columns selector
The below options are selected by default for the Pageview logs viewer.
Proxy logs columns selector
The below options are selected by default for the Proxy logs viewer.
By default, records for only the delivery statuses of 0, 14, and 16 display. Whenever the Delivery status, Cache Source, or Url Map column is selected, records for all delivery statuses display.
More columns selector options
For all four logs types, there is a three vertical dots menu icon on the upper-right corner of the columns selection window. Click it to access options to display all columns, or only the default ones.
Group-by selector
Group the logs by a selected logs attribute from the group-by drop-down menu. Select a logs attribute from this menu to trigger a drill-down and create a new group view.
Table customization
The records table offers several customization options - sorting, resizing and reordering.
Sorting
Click a column header to order logs by that logs attribute in ascending order. Then, click again to reverse the sort order.
Resizing
Hover column headers to make the column selection window visible. The window will provide a darker background color and a line at the head to indicate that the column can be resized.
Then, move the cursor towards the line at the end of the column header hover selection. Clicking and dragging the line will expand or shrink individual column widths.
Reordering
Hover column headers to make the column selection window visible. The screenshot in the Resizing section above shows what the column selection window looks like. Then click and hold the mouse down to see the cursor change indicating that the column can be reordered. Then drag and drop the column header to reorder the column.
Cell options
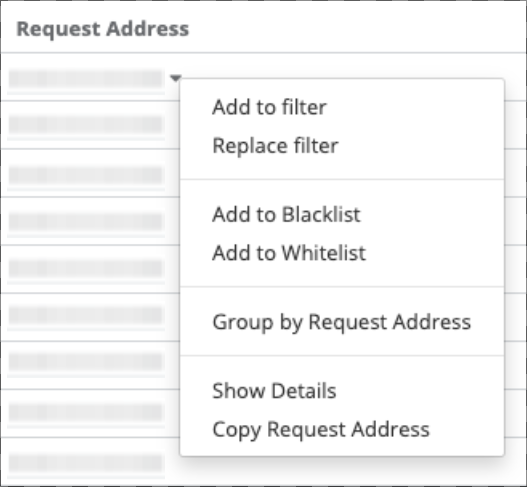
Access cell options by either right-clicking the data cell or clicking the drop-down arrow that appears on cell hover.
There are several options accessible through this drop-down menu depending on the cell. These options are listed below.
Add to filter
Add a predicate to the current filter to only show records that have the cell’s value for its column.
Replace filter
Overwrite the predicate on the current filter to only show records that have the cell’s value for its column.
Add to blocklist “Blacklist”
Add an IP address to the blocklist from the records view. This option only shows up if the cell is an address. Clicking on this option adds the address to the address set that is being used as the application’s blocklist.
You get a confirmation of adding the address to the blocklist every time this option is clicked. If the address is already in the allowlist, the address once added will also be in the blocklist. Before adding it to the blocklist, you get a confirmation that you want to add the address to the blocklist when it’s also in the allowlist even though the allowlist overrides the blacklisted addresses. Once confirmed, the address is added to the blocklist.
If the address is already in the blocklist, you no longer see the menu option Add to blocklist “Blacklist”. Instead this option is replaced with the Remove from blocklist “Blacklist” option. Clicking this option gives you a confirmation of the removal of the address. Once confirmed, the address is removed from the blocklist.
Add to allowlist “Allowlist”
Add an IP address to the allowlist from the records view. This option only shows up if the cell is an address. Clicking on this option adds the address to the address set that is being used as the application’s allowlist.
You get a confirmation of adding the address to the allowlist every time this option is clicked. If the address is already in the blocklist, the address once added will also be in the allowlist. Before adding it to the allowlist, you get a confirmation that you want to add the address to the allowlist when it’s also in the blocklist. Once confirmed, the address is added to the allowlist.
If the address was already in the allowlist, you no longer see the menu option Add to allowlist “Whitelist”. Instead this option is replaced with the option Remove from allowlist “Whitelist”. Clicking this option gives you a confirmation of the removal of the address. Once confirmed, the address is removed from the allowlist.
Group by ______
Drill down to a new Group View with the cell value as the grouping metric.
Show details
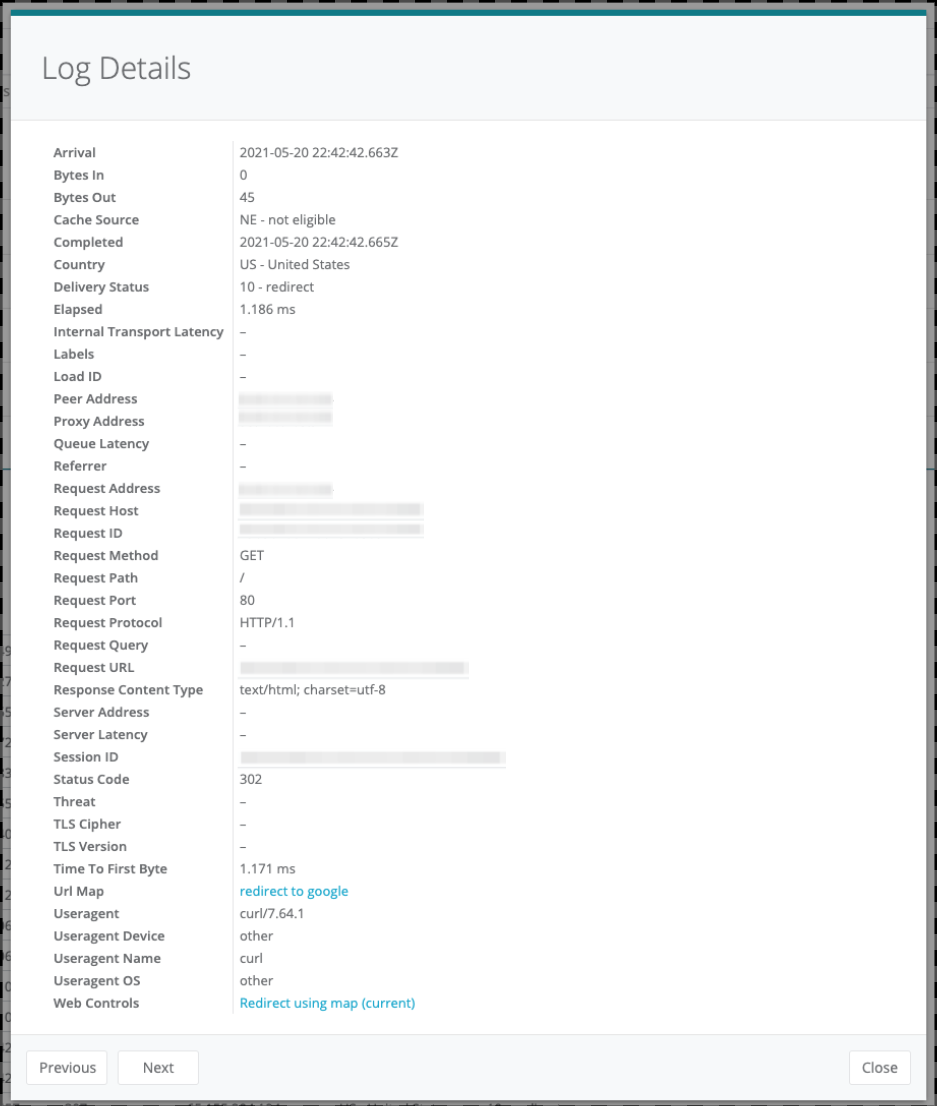
Show the view containing all details for that record entry. A double-click on a row will also show these details.
Here’s an example of an access log record’s details:
You can navigate to the next or previous record entry’s details by clicking the “Next” or “Previous” buttons respectively.
Copy ______
Copy the cell value to the clipboard.
Group view
Use the group view to get a broad analysis of logs. It provides an overview of all logs based on your selected group.
Back “Arrow” button
Click the arrow button to navigate to the previous records view.
Toggle visibility
Click the icon ( ) positioned to the right of the “Group” label above the table to display and hide the group logs.
Graph group button
Click the icon ( ) to the right of the visibility icon to apply a grouping to the graph. By default, the data points plotted in the grouped graph reflect the first five groups in the table.
Group drop-down menu
Update the grouping metric without creating a new view by selecting the new field within the grouping drop-down menu.
Table customization
The group table offers the same customization options as those in the records view - sorting, resizing and reordering.
Show logs
Select the arrow to continue to drill down to a new “Records View” for the logs in that group. This action triggers the transition to a new records view and adds the grouping value to the filter, thus only showing the logs within that grouping item.
Aggregate selector
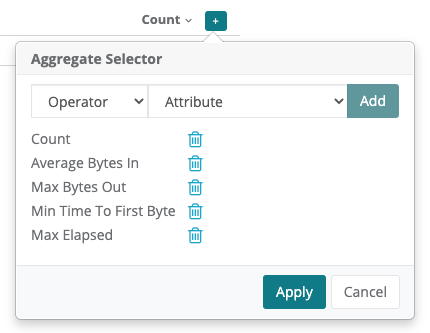
The group table allows you to access more grouping analysis through the + aggregate selector menu button.
The columns that can be added are called aggregable columns. An aggregate column can be added by the following process:
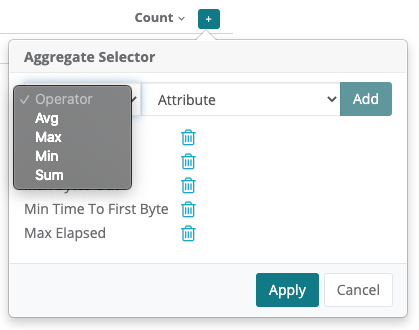
- Select an operator from the “Operator” dropdown.
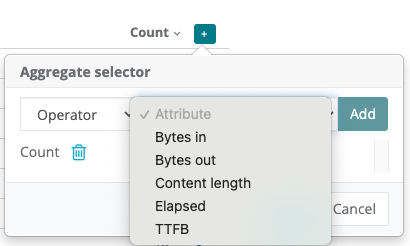
- Select an attribute from the “Attribute” dropdown.
- Click the “Add” button.
- More aggregate columns can be added by following steps 1-3.
- Once you have all the columns needed to be displayed, click the “Apply” button.
An aggregate column can be removed from the view by the following process:
- Click the icon ( ) next to the aggregate column label.
- More aggregate columns can be removed from the view by clicking their respective trash icons.
- Once you have all the columns needed to be removed from view, click the “Apply” button.
Operators
Aggregable columns are the numerical columns for each logs type.
The operators and their respective meanings are described below:
| Operator | Explanation |
|---|---|
Count |
The total number of requests served by the proxy for each of the groups. |
Avg |
The average numerical value is computed from all the values in the aggregable column. |
Max |
The maximum numerical value is computed from all the values in the aggregable column. |
Min |
The minimum numerical value is computed from all the values in the aggregable column. |
Sum |
The total numerical value is computed from all the values in the aggregable column. |
Attributes
The aggregable attributes for each of the logs type are listed below. The CSP Report logs do not have any numerical columns and therefore have no aggregable columns. So the “+” button is absent in the group view for CSP logs.
CDN logs aggregable attributes
These are the aggregable columns available in the group view for the CDN viewer:
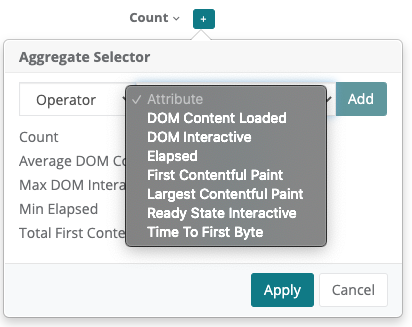
Pageview logs aggregable attributes
These are the aggregable columns available in the group view for the pageviews viewer:
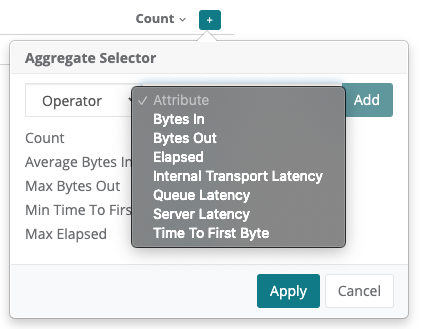
Proxy logs aggregable attributes
These are the aggregable columns available in the group view for the traffic viewer:
Further reading
- The Webscale Control Panel Dashboard
- Building Filters in Traffic Viewer
- Logs on Webscale
- Security How-Tos
- Working with Address Sets
Have questions not answered here? Please Contact Support to get more help.
Feedback
Was this page helpful?
Glad to hear it! Have any more feedback? Please share it here.
Sorry to hear that. Have any more feedback? Please share it here.
