Configuring and Viewing Custom Logs
Webscale has developed a log monitoring agent called the Webscale Monitoring Agent (WMA) that can be configured to send application or any application related logs (referred to as Custom Logs) to the Webscale Traffic Viewer and the Webscale Logs Viewer for viewing, debugging, and troubleshooting.
The WMA logging service can be configured through the Cluster blueprint editor for both VM and Kubernetes based cluster deployments.
The WMA will monitor specified files for write events and will send the contents of those logs to Webscale. These logs can then be filtered and viewed in the Webscale Control Panel via the Traffic Viewer and Logs Viewer.
Logging Configuration
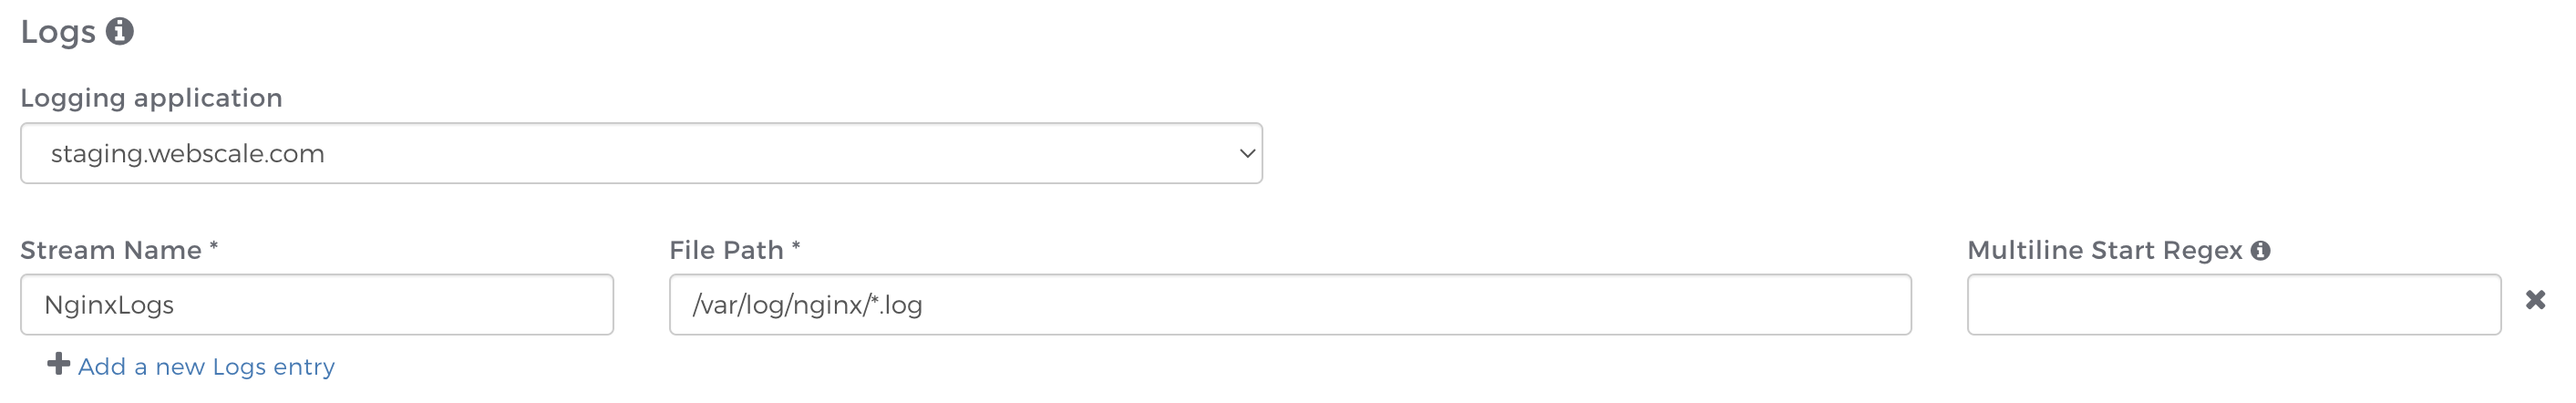
When creating a Cluster blueprint, if your application is subscribed to Custom Logs, you will see a configuration prompt to select a logging application. This specifies which application your cluster belongs to. Once selected, you will be prompted to configure your log stream.
A log stream is a group of log entries from a specific file path. We recommend naming your log stream something that will help you quickly identify what logs you are looking at. Then specify a file path to monitor for these logs. This must be an absolute path and cannot be a directory, but you may use a single * wildcard to monitor multiple log files in a single directory.
For example: /var/log/nginx/*.log as a file path will tell the WMA to monitor for any files with a .log extension in the /var/log/nginx/directory.
Note:
Custom Logs are an add-on feature that may not be enabled for your account or application. Please contact Webscale Support to request access to this feature.Multiline Logs
By default, the WMA will divide your logs into individual log records line by line. However, a multiline start regex can be specified if your log file contains multiline logs that are divided by a delimiter. This delimiter must appear at the start of the line. To capture these multiline logs, you must provide a regular expression that matches this delimiter.
Often, timestamps are used to divide logs. Here are three common timestamp formats and the regular expression used to match them:
Sample timestamp: 1994-11-05T13:15:30Z
Regular Expression: \d{4}-\d{2}-\d{2}T\d{2}:\d{2}:\d{2}Z

Sample timestamp: 2023/06/30 19:41:45
Regular Expression: \d{4}/\d{2}/\d{2} \d{2}:\d{2}:\d{2}

Sample timestamp: [2023-06-30T12:07:30.743Z]
Regular Expression: \[\d{4}-\d{2}-\d{2}T\d{2}:\d{2}:\d{2}\.\d{3}Z\]
Container Logs
For cluster blueprints using an EKS service, an additional option will be available to capture logs written to stdout or stderr of the container. Simply select the checkbox and save the configuration to have these logs sent to Custom Logs in their own stream. You also have the option to rename this stream or use the default name of “ContainerLog”.
Logs Viewer
Custom Logs are viewable in the Webscale Control Panel. These Logs can be crucial for monitoring system performance, troubleshooting issues, and ensuring smooth operations. Custom Logs can be viewed in two locations: Traffic Viewer and Logs Viewer.
The Traffic Viewer is a powerful tool for extracting information from logs, such as Proxy Logs, Pageview Logs, CDN Logs, or Custom Logs, and for viewing aggregate data and trends over time. (Learn more about the Traffic Viewer)
The Log Viewer is designed for viewing the contents of text based logs (Custom Logs). It simplifies log filtering to allow for swift and efficient debugging and log analysis.
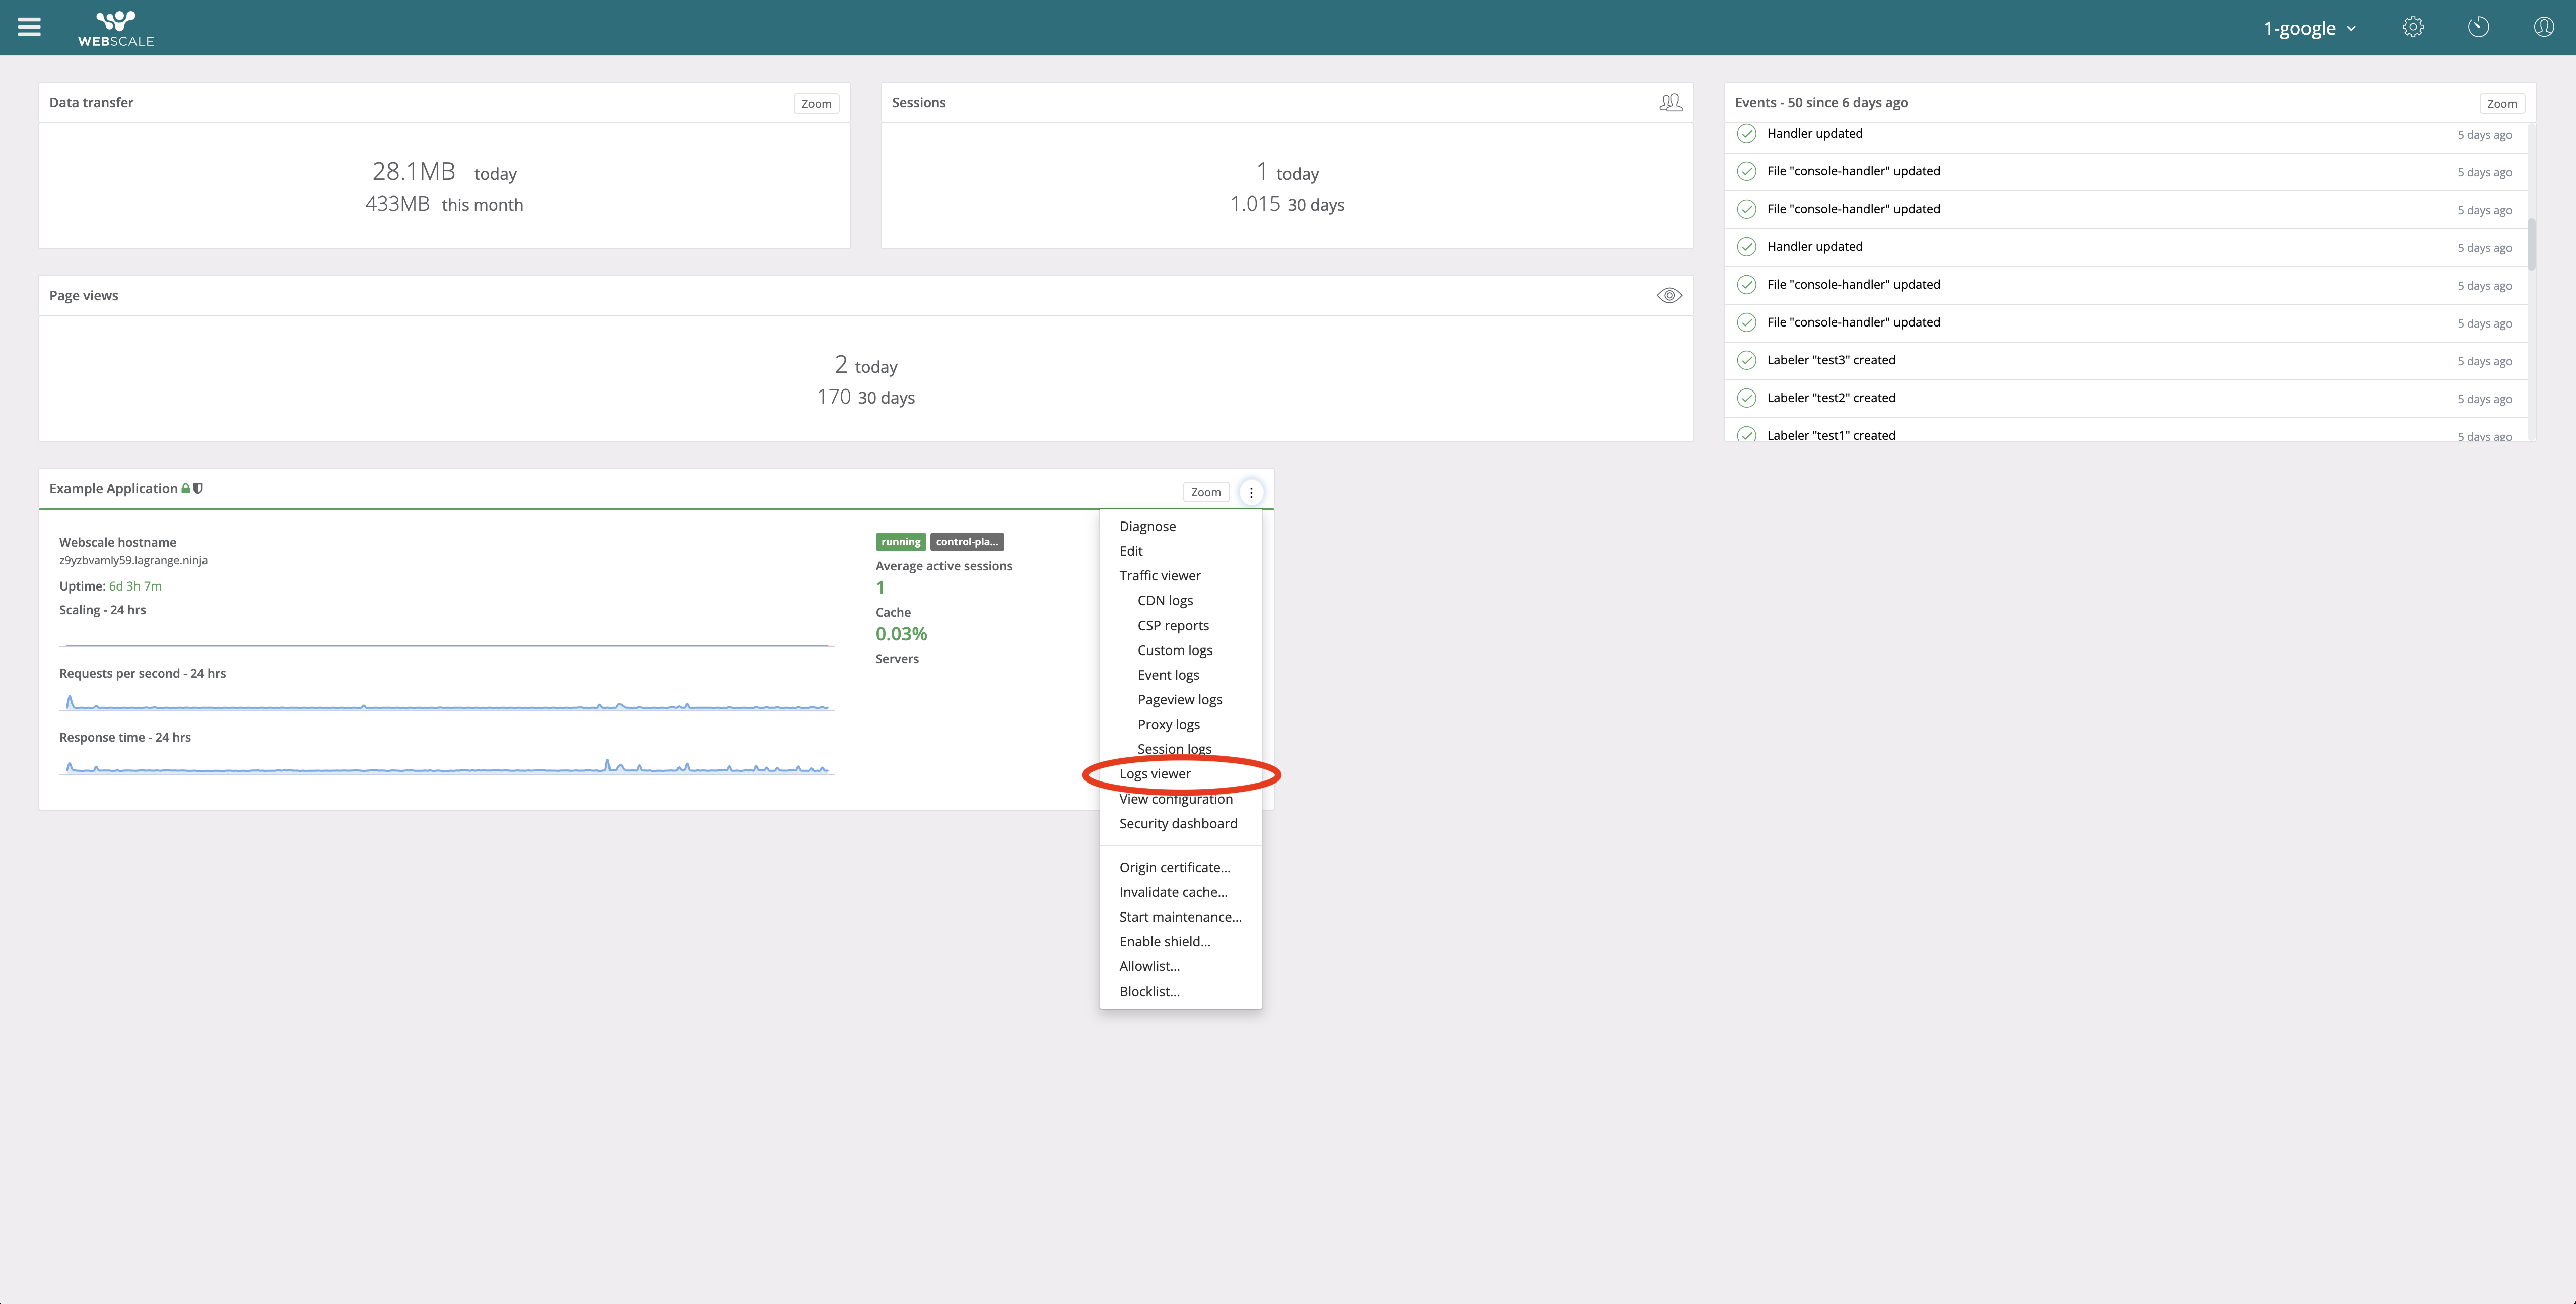
| 1. Login to the Webscale Control Panel, locate the application for the desired Custom Logs, and open the application’s action menu. If the account has an entitlement to Custom Logs the Logs Viewer option will be available. This menu is also reachable from the application’s dashboard. | |
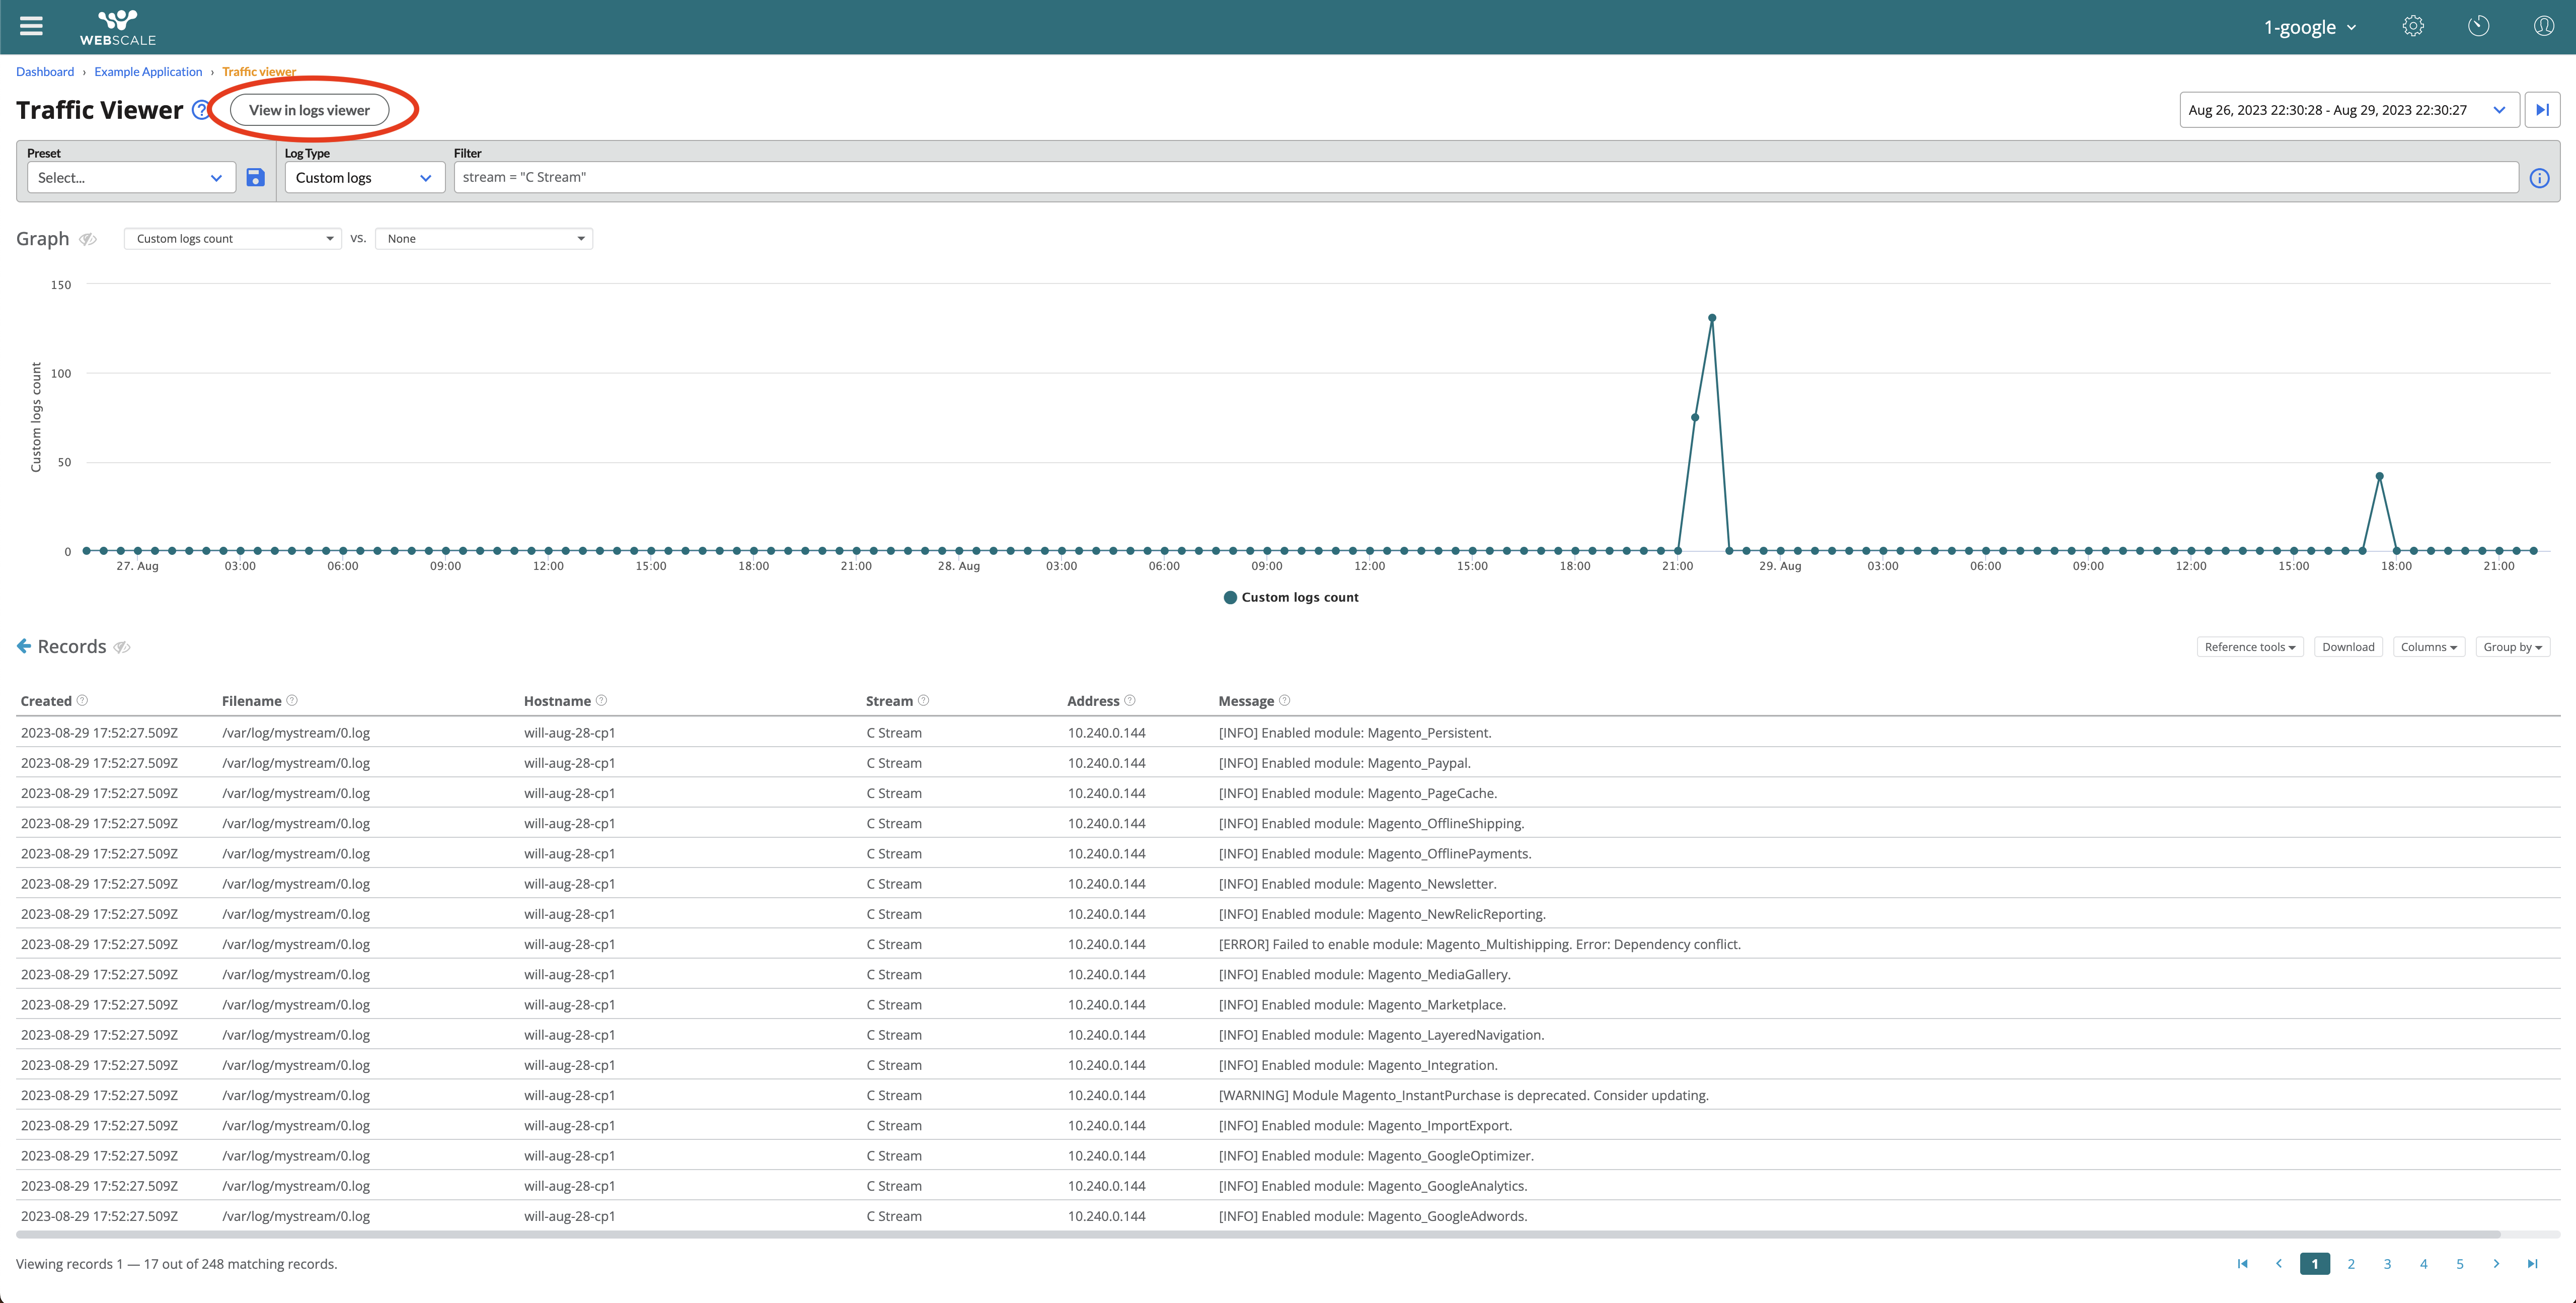
| 2. To reach the Logs Viewer from the Traffic Viewer, change the Log Type to Custom Logs and click the “View in logs viewer” button. | |
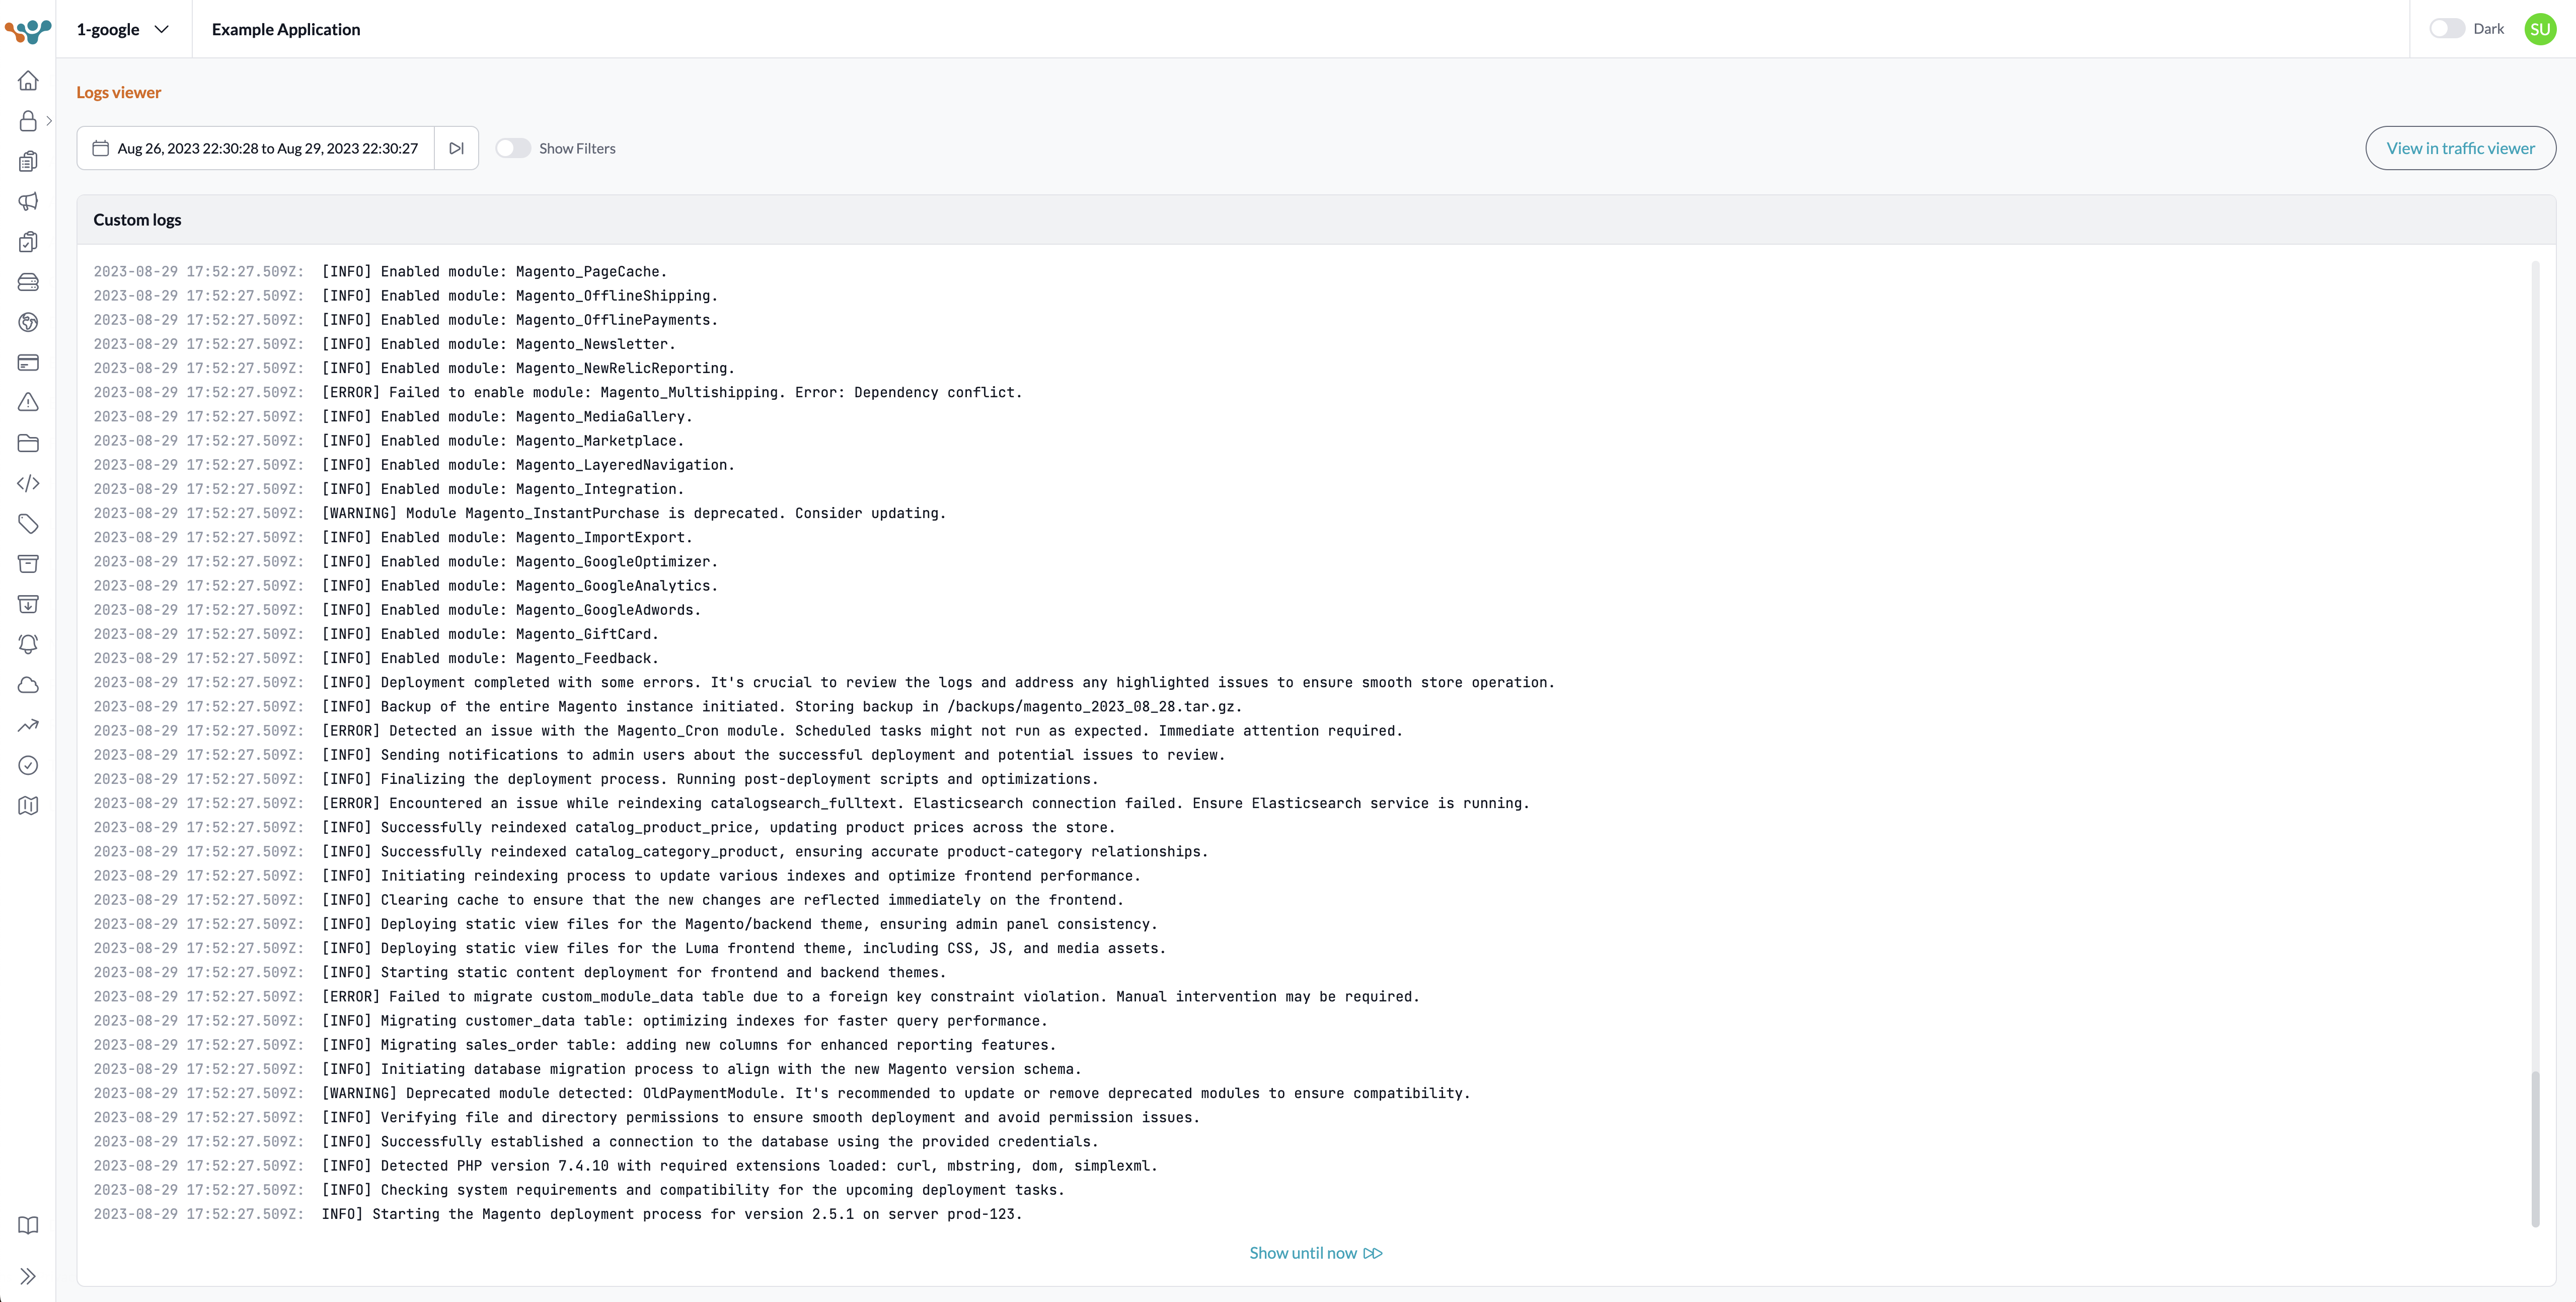
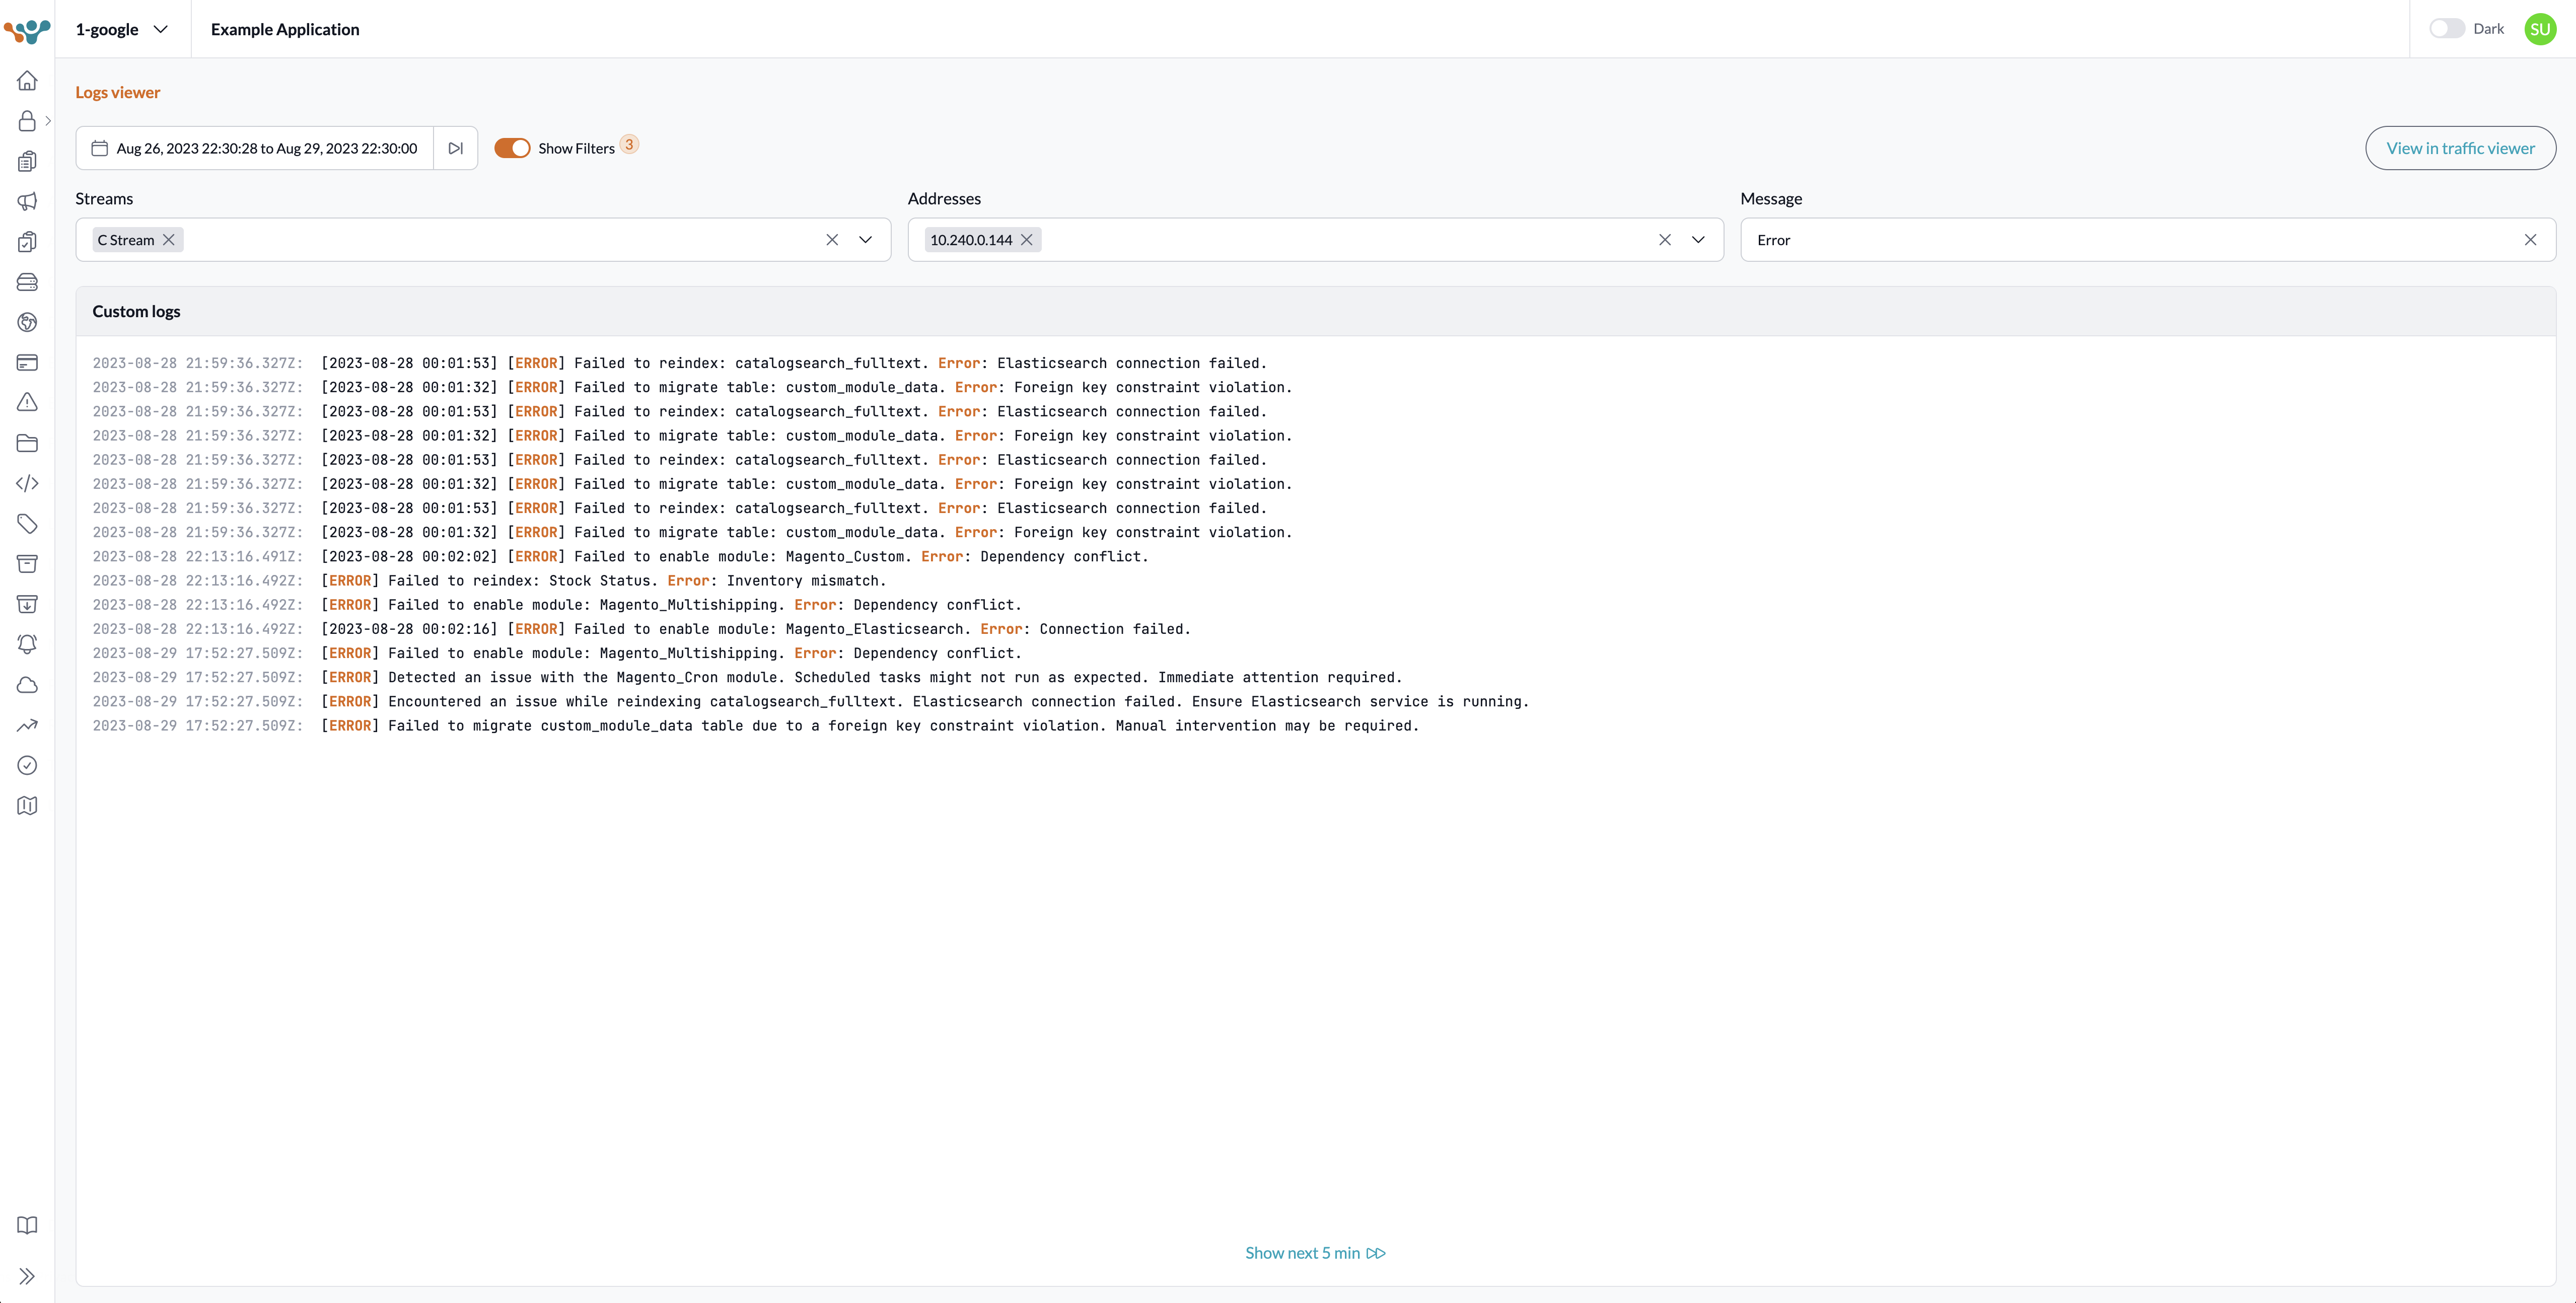
| 3. By default, the Logs Viewer page does not apply any log filters and hides the filter inputs. The default time range is the most recent 5 minutes. The timestamps on the left of the logs indicate the logs’ creation time. | |
| 4. If accessing the Logs Viewer via the Traffic Viewer, the time range set in the Traffic Viewer will be used in the Logs Viewer. Any Streams, Addresses, or Message filter parameters set in the Traffic Viewer will also be applied in the Logs Viewer. However, other filters like Filename or Hostname will not be applied. | |
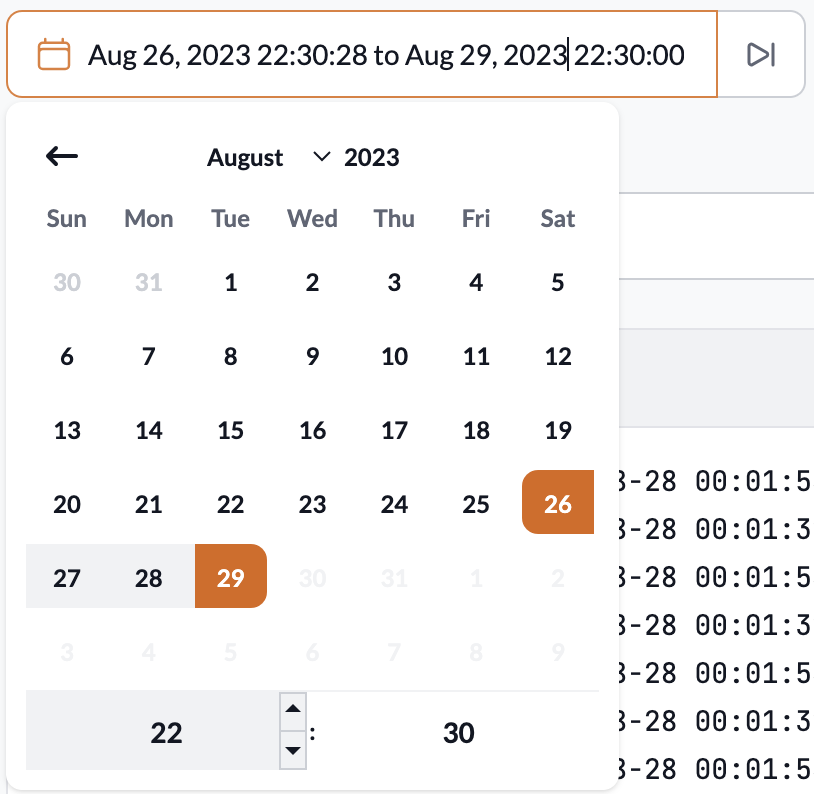
| 5. To set a time range, click on the desired start date and input the start time. Then, click on the end date and input the end time. Use the “Forward to Now” button to advance the end time to the present, adjusting the start time accordingly to maintain the time range duration. | |
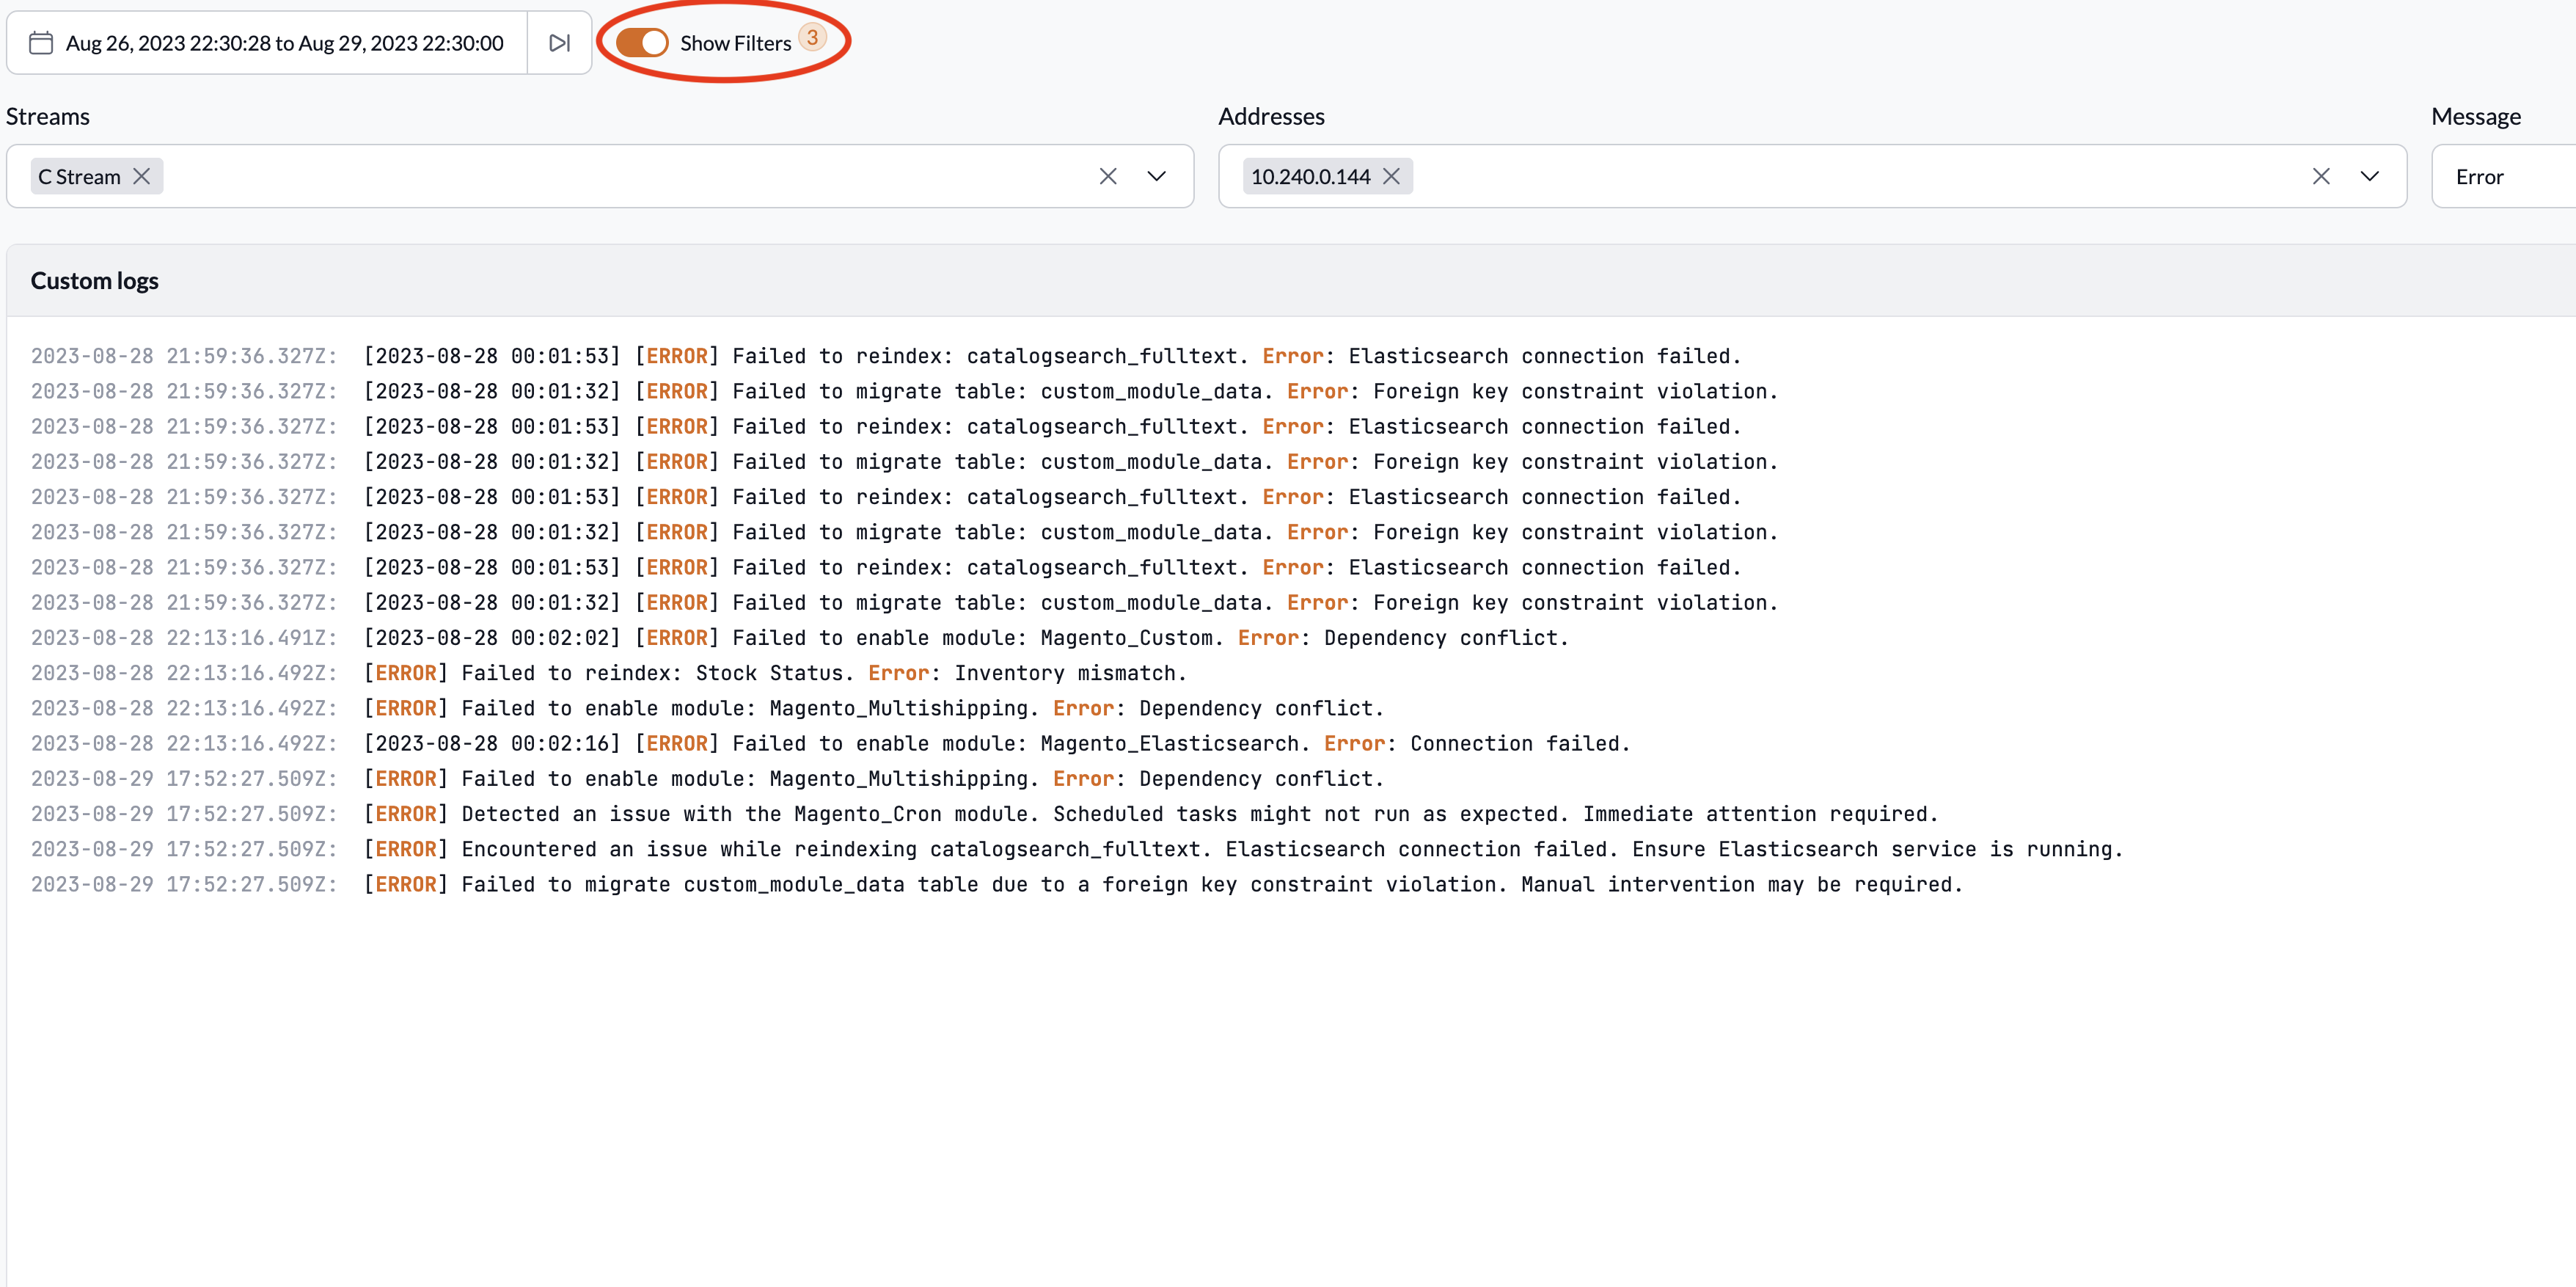
| 6. Activate the “Show Filters” toggle to see the three Log Viewer inputs: the Streams filter (for filtering by various log sources as set in the Logging Configuration), the Addresses filter (for filtering by the server’s IP address that produced the logs), and the Message filter (for filtering by specific words in a log entry, but not fragments of a word). As filters are set, the count of active filters is displayed next to the “Show Filter” toggle. | |
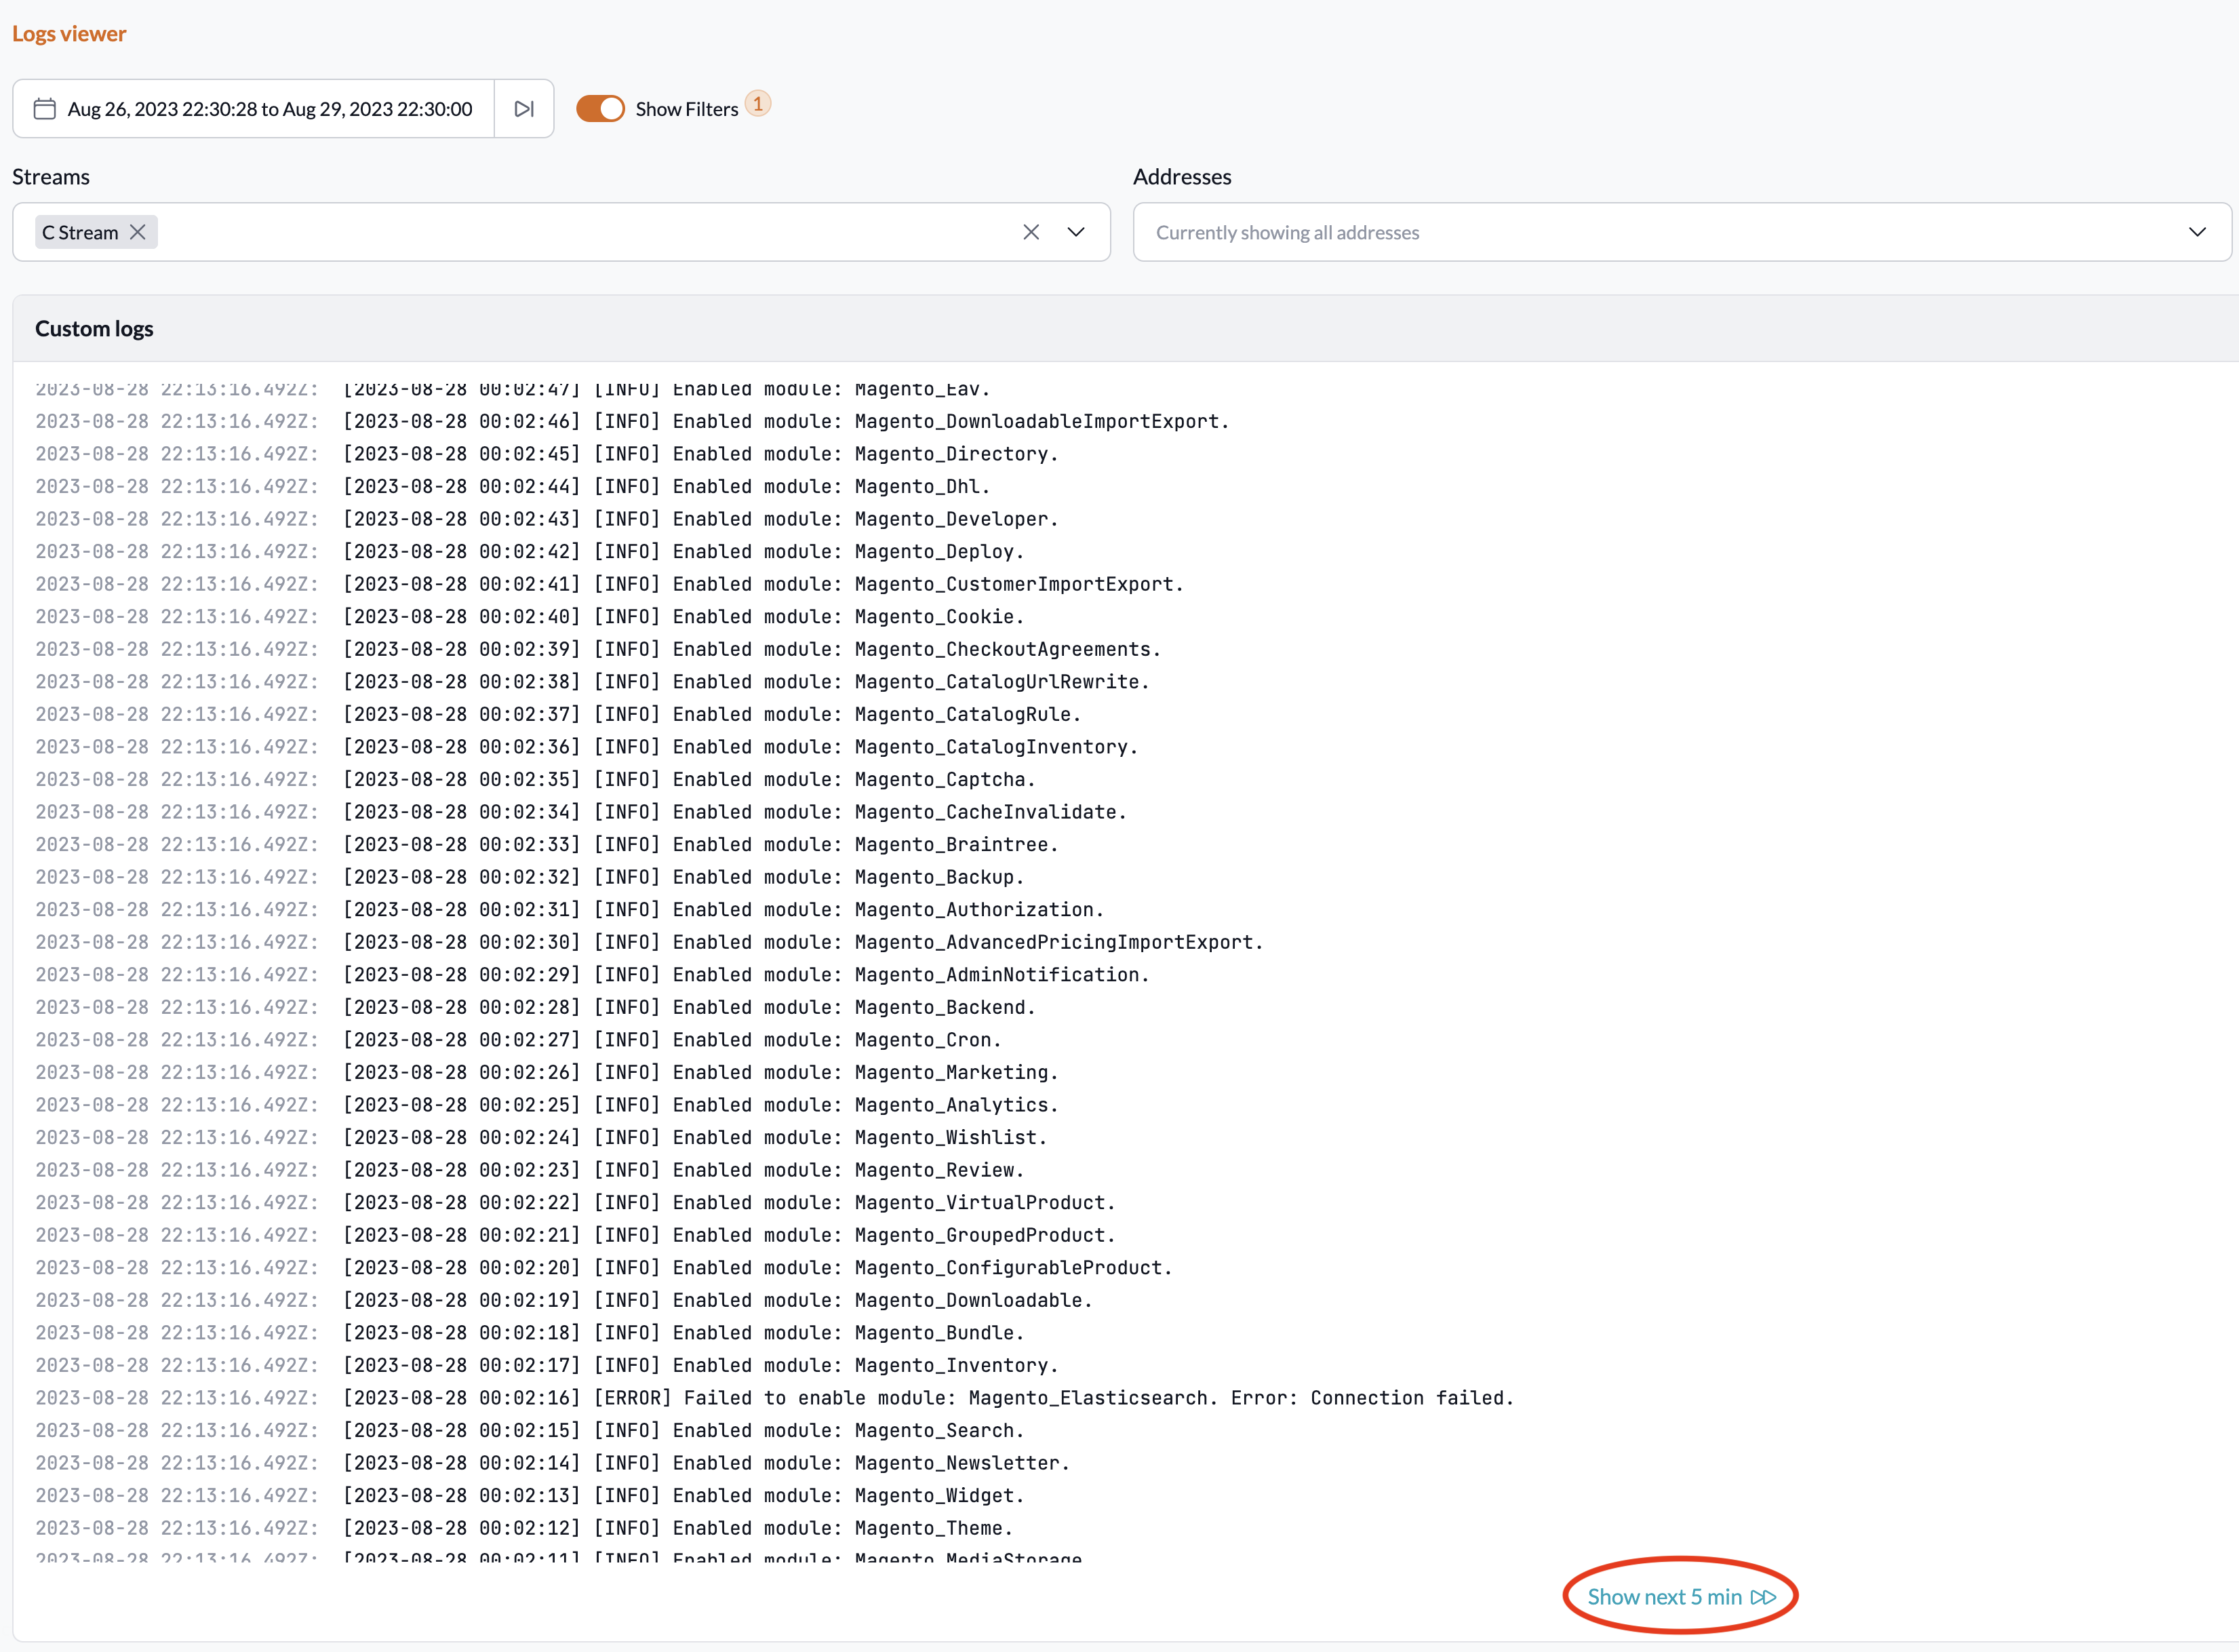
| 7. When you reach the end of a log range, you can transition to a new log set by clicking the “Show next 5 min” button. This action sets a new start time immediately after the previous end time and establishes a new end time 5 minutes later. If less than 5 minutes remain until the current time, the button will display “Show until now”. |
Further reading
- Creating Clusters
- VM Clusters
- Kubernetes Clusters
- Managed Deployments
- Logs on Webscale
- Traffic Viewer
Have questions not answered here? Please Contact Support to get more help.
Feedback
Was this page helpful?
Glad to hear it! Have any more feedback? Please share it here.
Sorry to hear that. Have any more feedback? Please share it here.