How to View Webscale Application Server Information
How to View Webscale Application Server Information in your Webscale Control Panel
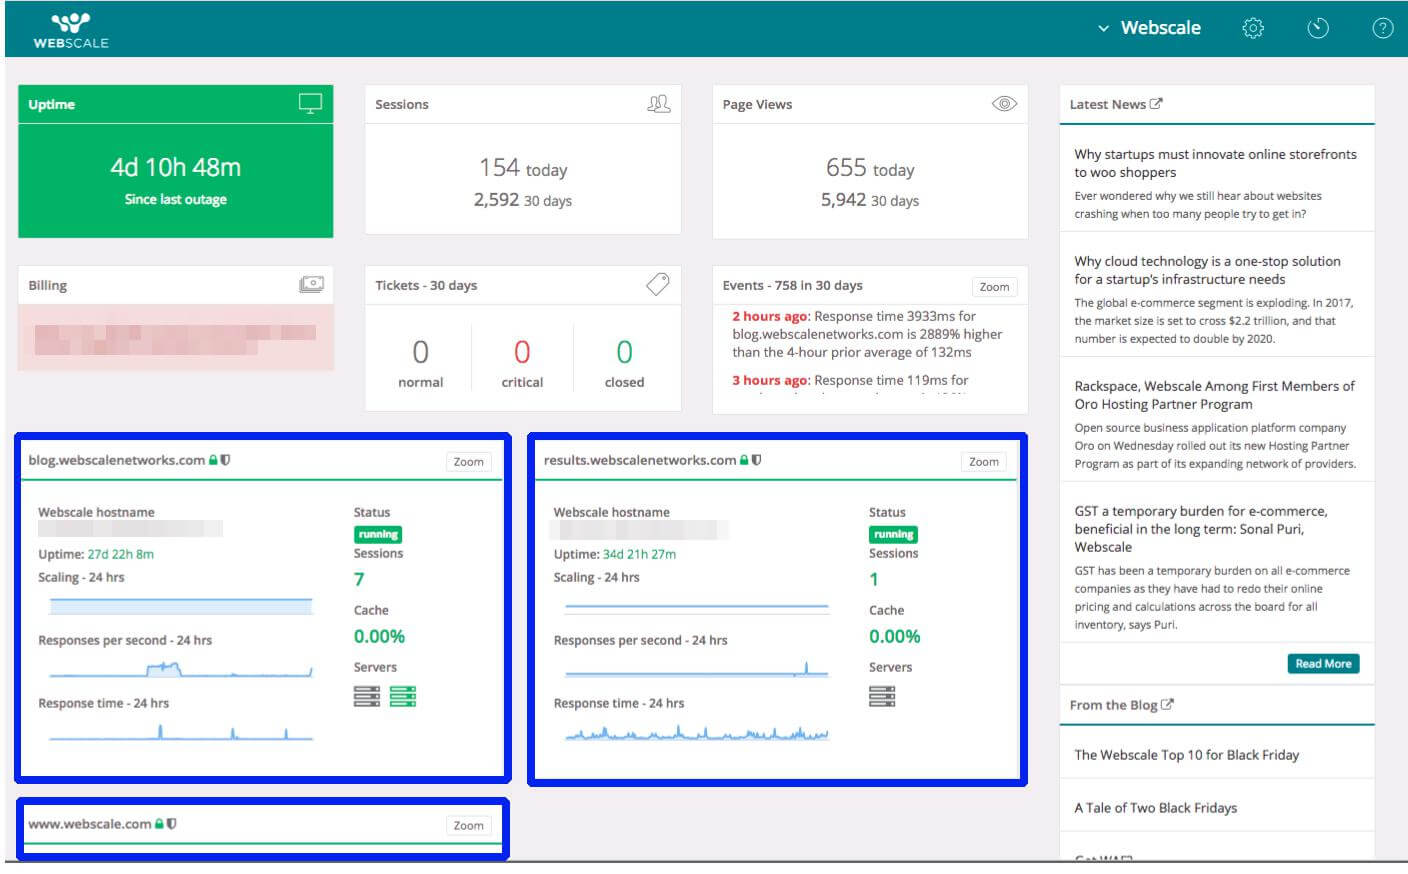
The Webscale Control Panel displays application server information and status. In the control panel you can find out how many servers are currently active, what are those servers’ IPs, if any additional servers are being scaled, and more.
View Application Server Information
From the Webscale Control Panel’s main page (called the Dashboard), each application section shows the following:
|
|
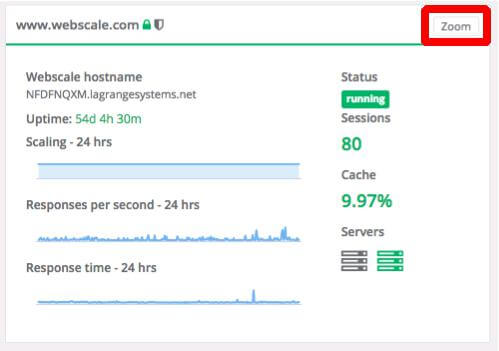
| Click the Zoom button to see more details for the specific application. | |
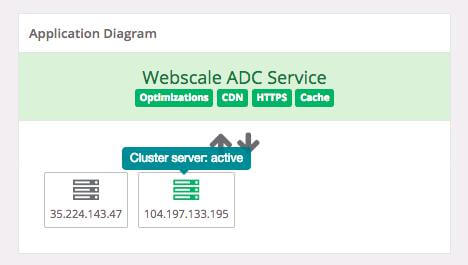
| On the application page, the Application Diagram section shows the currently active servers, as well as any servers currently scaling in or out. A list of the IP address for each server is below the server icon. Hover your mouse over the server icon for additional info. | |
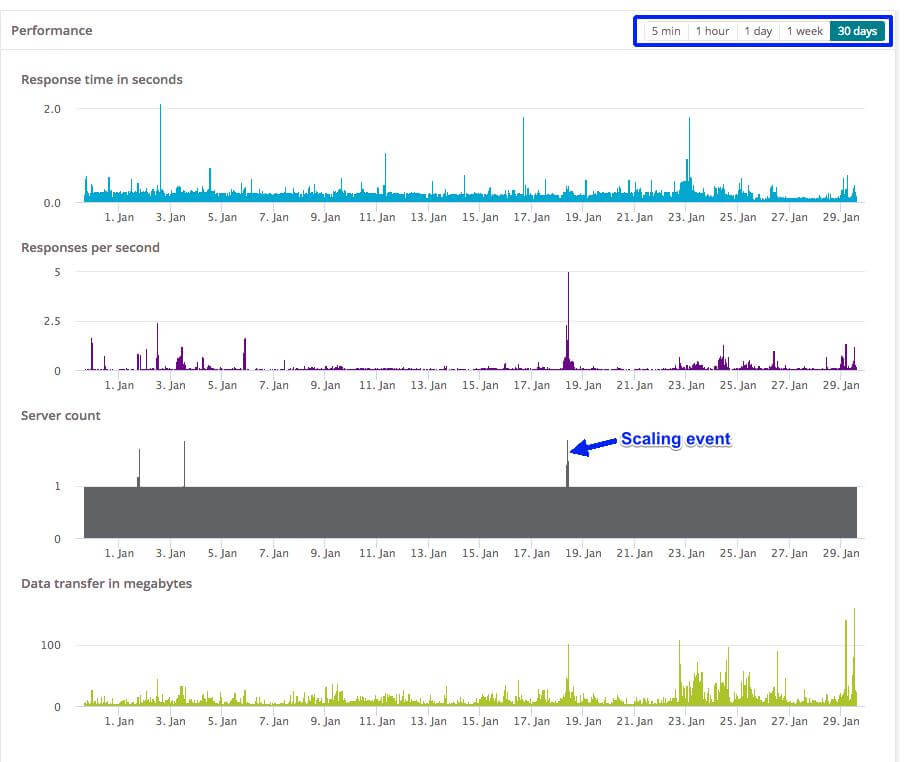
The Performance section shows the following for the timeframe you have selected:
|
|
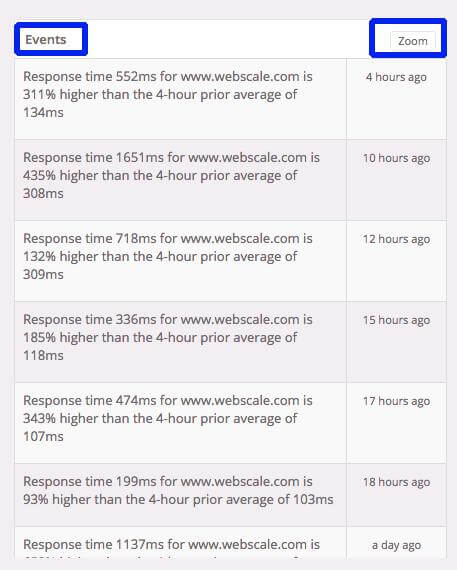
| The Events section shows a running log of all events, including scaling in and scaling out events. Click the Zoom button for more details and calendar options. |
Further Reading
Have questions not answered here? Please Contact Support to get more help.
Feedback
Was this page helpful?
Glad to hear it! Have any more feedback? Please share it here.
Sorry to hear that. Have any more feedback? Please share it here.
Last modified April 7, 2020