Building Traffic Viewer Filters
You can use the Traffic Viewer Filter field to create filters for the logs search query. Along with the time range and logs type option, the filter defines the query.
The filter builder enables you to easily navigate records to find specific logs interactions. There are many ways to build filters; some methods depend on how you are viewing logs (records or groups view). For information on the records and groups views as well as how to use Traffic Viewer, see Using Traffic Viewer .
The Traffic viewer logs type option pertains to proxy logs.
Topics
- Access Traffic Viewer
- Basic filter functionality
- Records view filter functionality
- Group view filter functionality
- Logs and report attributes
- Examples
Access Traffic Viewer
You can access Traffic Viewer for each log type through the Webscale Control Panel.
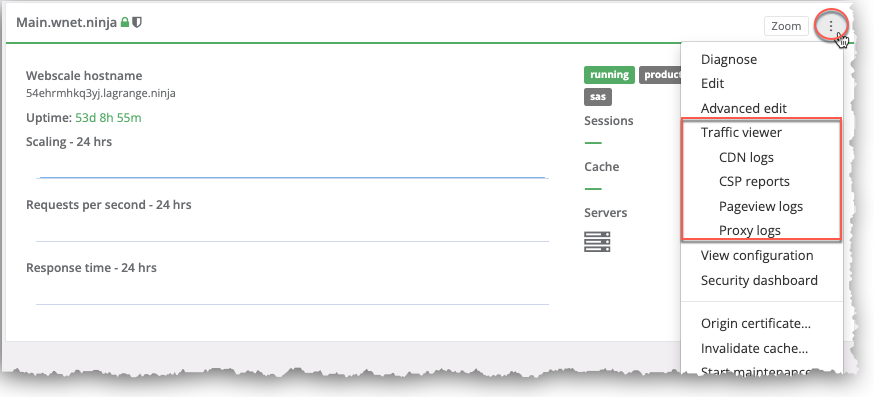
To access Traffic Viewer
Click the three vertical dots menu icon on the upper right corner of the application box and select a logs type option from the Traffic Viewer sub-menu.
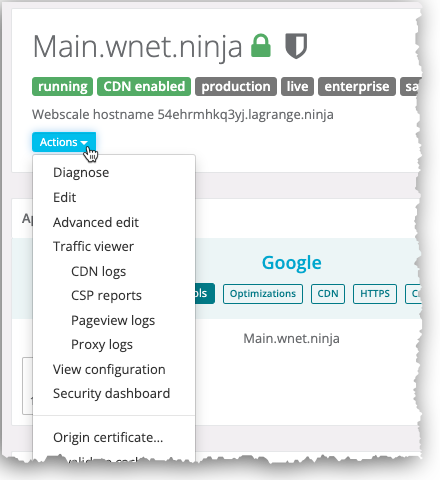
-or-
On your application page, click the Actions menu icon and and select a logs type option from the Traffic Viewer sub-menu.
Basic filter functionality
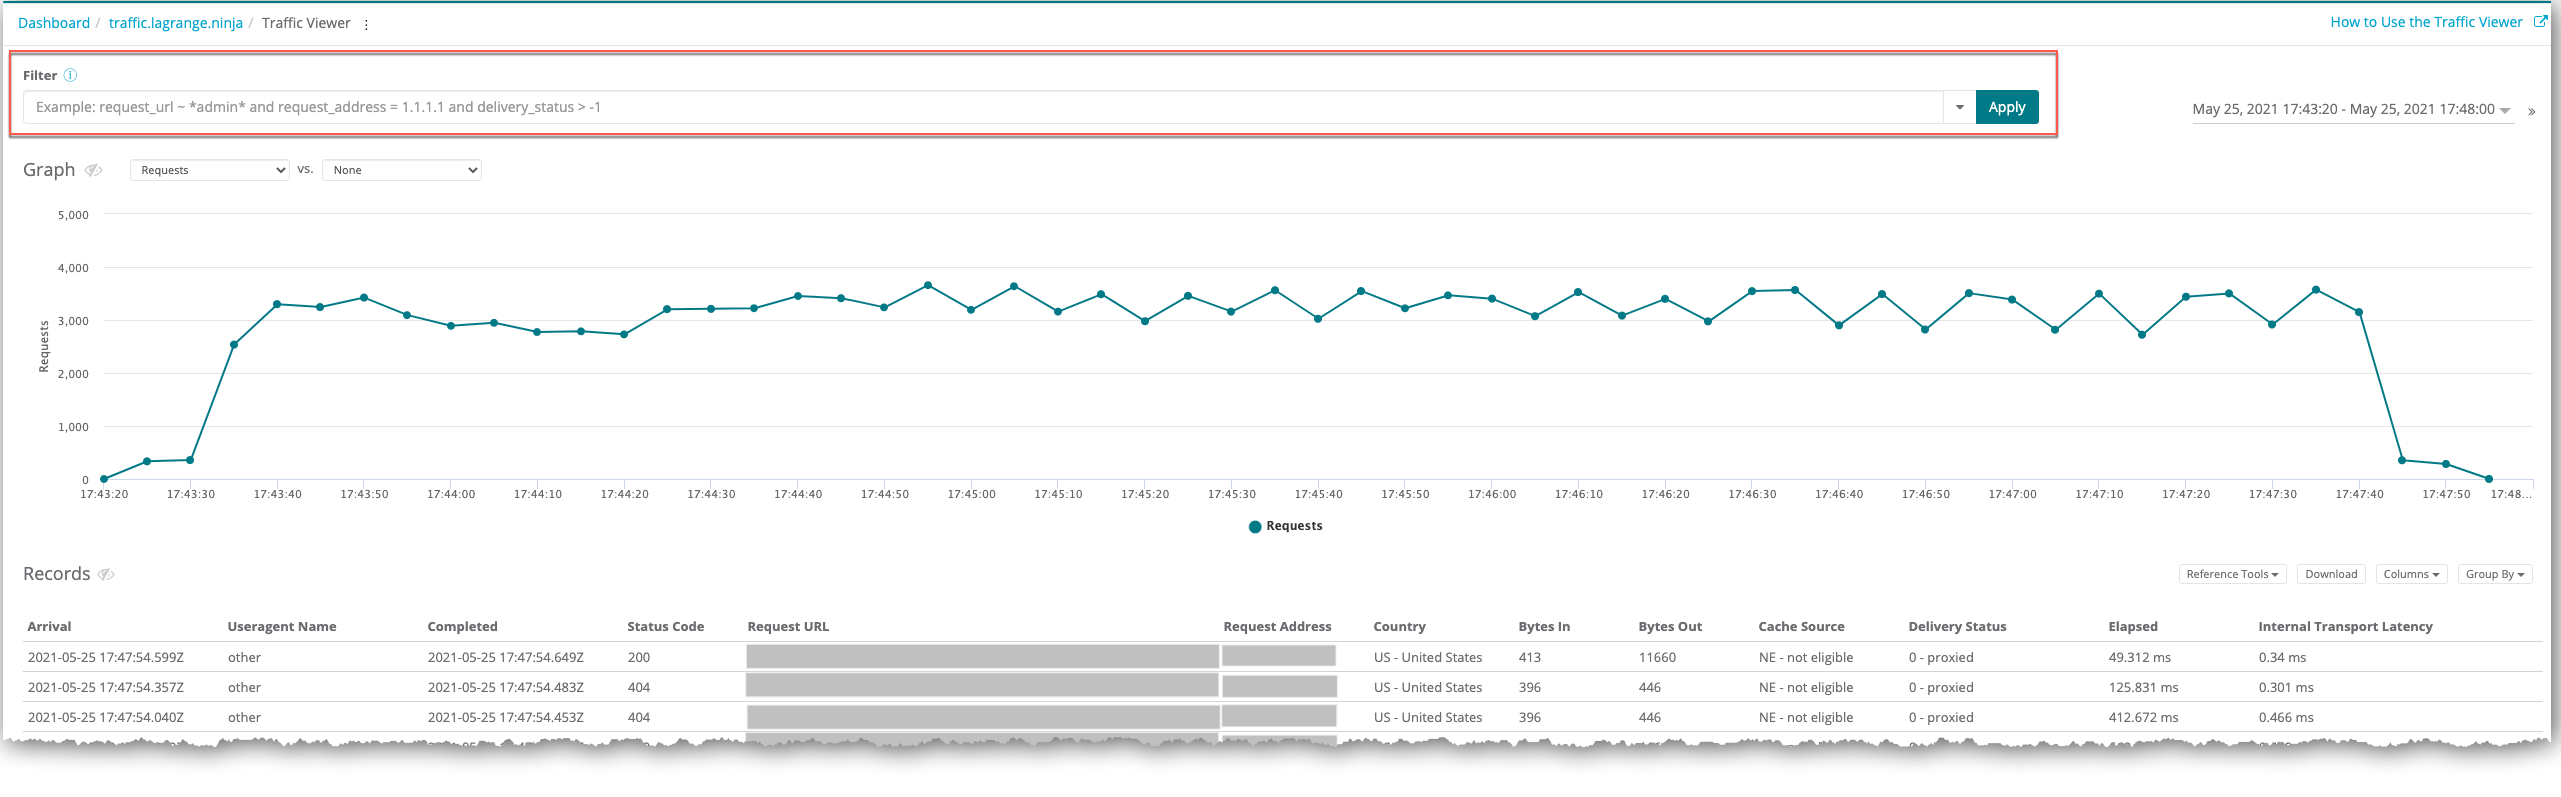
For all Traffic Viewer logs type pages, you can access the following basic filter functionality through the Filter field.
- Example query: An example query displays in the Filter field as a model on how to construct your query.
- Filter log attributes: You can see the filter log attributes available for the logs type by clicking on the info icon just above the Filter field.
- Filter history: If you previously created filters, the last twenty filter queries for your current Traffic Viewer session display in the Filter field drop-down menu.
- Apply filter: You can apply a filter by clicking Apply or pressing Enter.
- Filter errors: If a query is malformed, an error appears below the Filter field.

Records view filter functionality
The records view of query results displays all logs of the selected log type that match the specified time range and filter.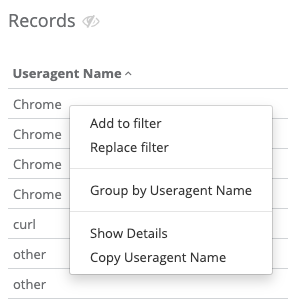
All general filter functionality applies to the records view along with a few additional features that relate to individual cells within a table. You can access these features by right-clicking the cell value or clicking the drop-down arrow that appears when you hover on a cell.
- Add to filter: Add a cell value to the filter by selecting Add to filter from the drop-down menu for the cell. This action appends the filter-formatted cell value and column header to your current filter. The logs view remains the same and does not trigger a new view.
- Replace filter: Replace your current filter with the value of a cell by selecting Replace filter from the drop-down menu for the cell. This action applies the filter format to the cell value and header, clears the current filter, and replaces it with the reformatted cell value and header. The logs view remains the same and does not trigger a new view.
Group view filter functionality
After you create a filter and apply it, you can choose a logs attribute from the Groups by drop-down menu to further refine your results. Only results that match the logs attribute for the group display.
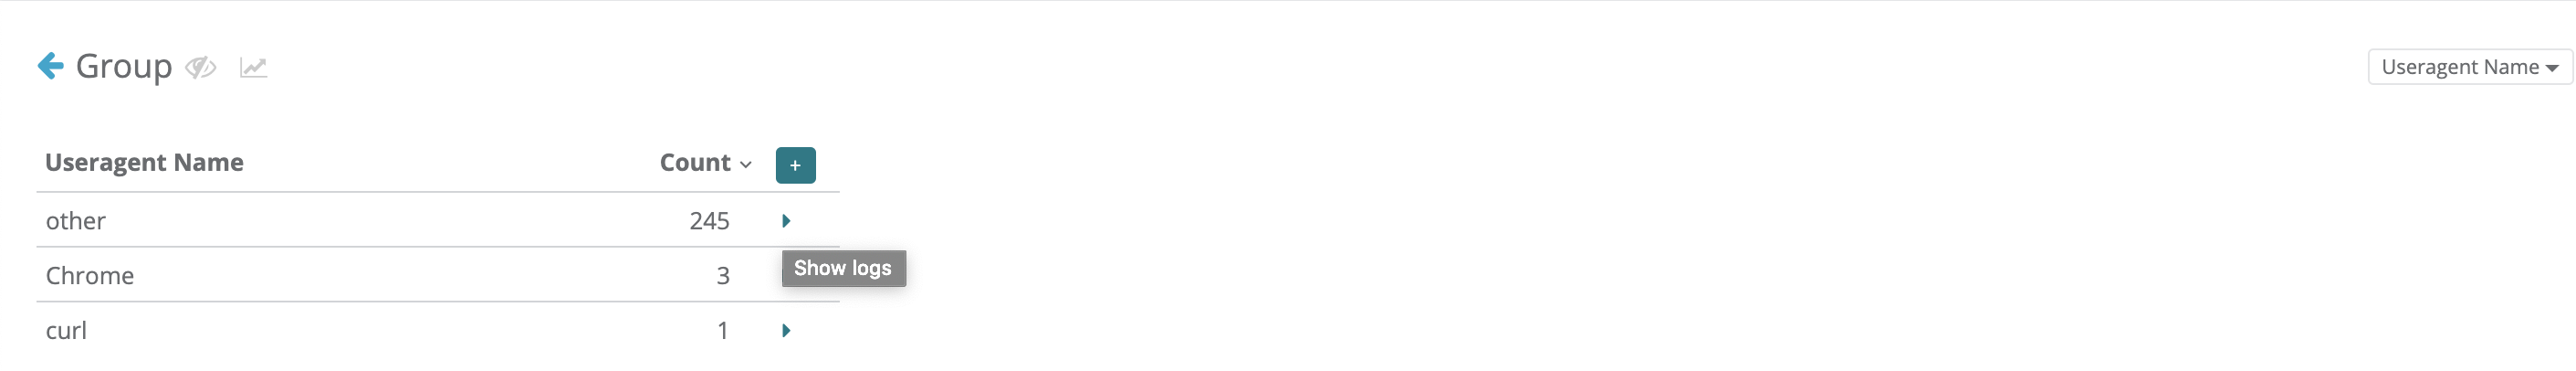
All general filter functionality also applies to the group view along with one additional feature: Show logs: To see all logs that apply to a group member, click the right arrow for the selection. This creates a new view with that group member value and header appended to your current filter.
Logs and report attributes
Depending on the logs type, you can use specific logs and report attributes when you create a filter.
CDN logs Attributes
For information on the logs attributes available for CDN logs filters, see CDN logs attributes .
CSP reports attributes
For information on the report attributes available for CSP reports filters, see CSP reports attributes .
Pageview logs Attributes
For information on the logs attributes available for Pageview logs filters, see Pageview logs attributes .
Proxy logs attributes
For information on the logs attributes available for Proxy logs filters, see Proxy logs attributes .
Examples
To see all search results, use delivery_status>-1 in your filter. Then, make changes to the query pattern and drill down the results to find specific types of traffic. You can include wildcards for queries with log attributes that return non-numeric values. To do so, use the ~ (tilde) character in conjunction with wildcards.
For more information on delivery status codes, see Delivery status codes on the Proxy logs attributes page.
- Find all instances of a 500 error:
delivery_status>-1 and status_code>500. - To see all results from a specific IP address, use the
request_addresslog attribute:delivery_status>-1 and request_address=192.0.2.0 - To check a specific URL on your application, use
request_path:request_path="/checkout/cart/" and status_code>=500 - Sort traffic based on useragent and use the bot useragent to see if bot traffic is an issue:
delivery_status>-1 and useragent~*bot* - Find all php requests that are not going to standard index.php location:
delivery_status>-1 and request_path~*.php* and request_path!~*index.php* and status_code>=400 - Check traffic to the Magento admin page:
delivery_status>-1 and request_path~*magento_admin_path* - Check customer post sql requests:
delivery_status>-1 and request_method~*POST* - Isolate traffic from a specific country:
delivery_status>-1 and country!~*US* - Global subnet-based requests:
delivery_status>-1 and request_address in 192.0.2.0/16
Further Reading
Last modified on June 3, 2026