Working with Monitors
The monitoring feature enables Webscale to track potential problems or system changes. Monitors generate events when they detect activity that matches or exceeds conditions that you define. They can send email notifications when these events occur.
For example, you can create monitors that notify you about website security violations or when the data transfer for outbound traffic exceeds a threshold.
The monitor type determines the activities that monitors can track.
- data-transfer-billing: Monitors data transfer for all account applications
- logs: Monitors traffic logs for specified applications
- data-plane: Monitors particular data plane attributes for changes
- signal: Monitors changes in signals for specified accounts or applications
- application: Monitors the configurations and resources of one or more applications in an account
When adding or editing a monitor, shared and type-specific settings become visible after selecting a type.

Topics
- Shared monitor settings
- Data transfer monitor
- Logs monitor
- Data plane monitor
- Signal monitor
- Application monitor
Shared monitor settings
All monitor types share the following settings.
- Name: Identifies the monitor
- Description: Provides a short description of the monitor’s purpose
- Type: Specifies monitor type
- Notify: Enables sending notifications when events that the monitor tracks occur
- Log events: Enables adding events that match monitor conditions to the event logs
- Manage tickets: Enables creation of support tickets when the monitor triggers
- Message: Enables customizing the notification message for
NotifyorManage ticketsactions
The Type and Name settings are required. The remaining settings are optional.
Note:
For the Notify setting, you can choose to send notifications to specified email address or to the Splunk On-Call third-party notification system if you have installed this product. (The former name for this system is VictorOps)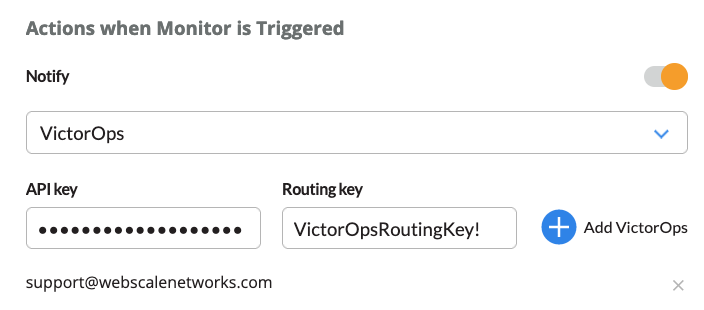
Notification messages
The Messages section enables you to create email notification messages. For some monitors, you can choose to create notifications that indicate potential problems. (A monitor will trigger when thresholds that you have defined are met or exceeded.) Webscale will send recovery messages when the monitor no longer detects potential threat conditions.
When creating messages. You can:
- Type a message in the Edit tab that Webscale sends for all circumstances
- Define dynamic messages that change according to the situation
Dynamic messages
Dynamic messages use variables that reference specific values from your Webscale account. The available variables are visible in the Context tab.
Message section
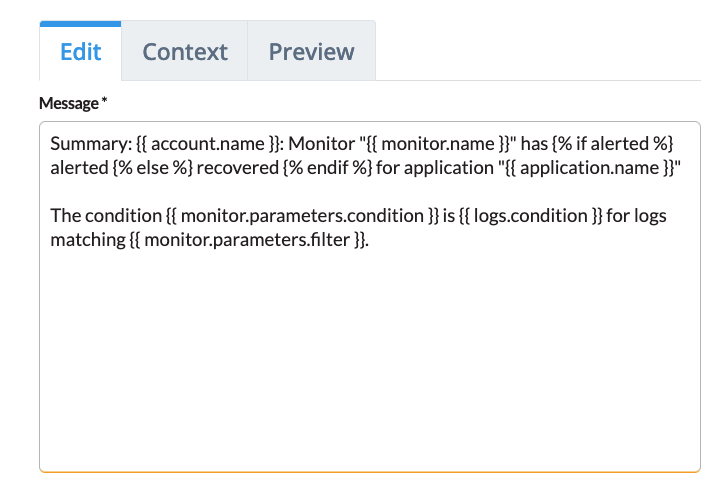
In the Message section:
- Edit tab: Displays a sample message that demonstrates how to use the context variables. You can modify or replace this sample message.
- Context tab: Displays the available variables for the message
- Preview tab: Displays a rendered version of the message
- Message type option menu: Specifies if the message is an alert or recovery notification. Displays when you select the Context tab.
When you create dynamic messages, Webscale uses Liquid templates to reformat your message into Markdown. Liquid then reformats it from Markdown into HTML for the email message.
A Liquid template also defines the message format. You can switch to another Liquid template to change the message appearance through Liquid. Liquid is an open-source template language for web applications. For more information about how to use Liquid, see the Liquid documentation.
Illustrated example
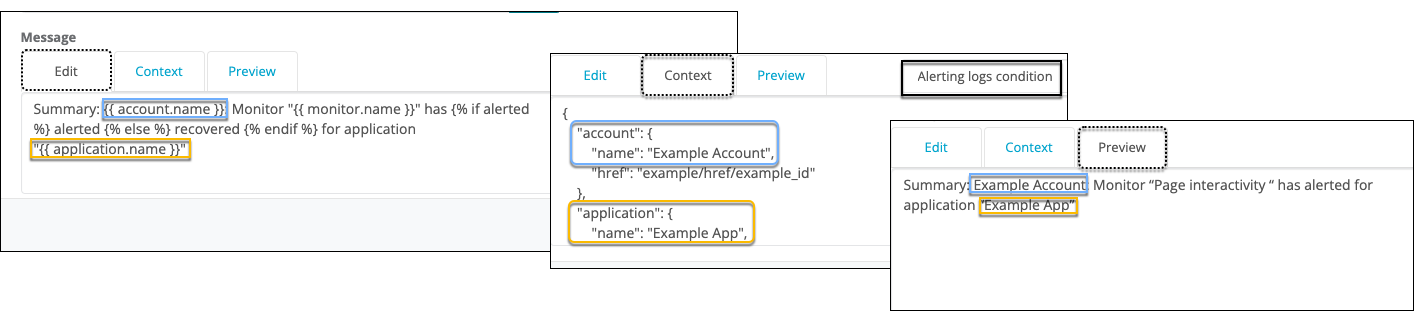
The above graphic illustrates how you can compose two sentences of a message, using variables from the Context tab. The Preview tab displays how they will render. The Alerting logs condition option menu selection determines that the message is an alert.
In the scenarios for the graphic, the boxes with the colored borders show how a variable can be used and rendered.
Note:
Webscale automatically populates the variables in the Context tab with corresponding system information. For example, if the host name for a monitor application is “example.com,” the application variable will include"default_hostname": "example.com".
Data transfer monitor
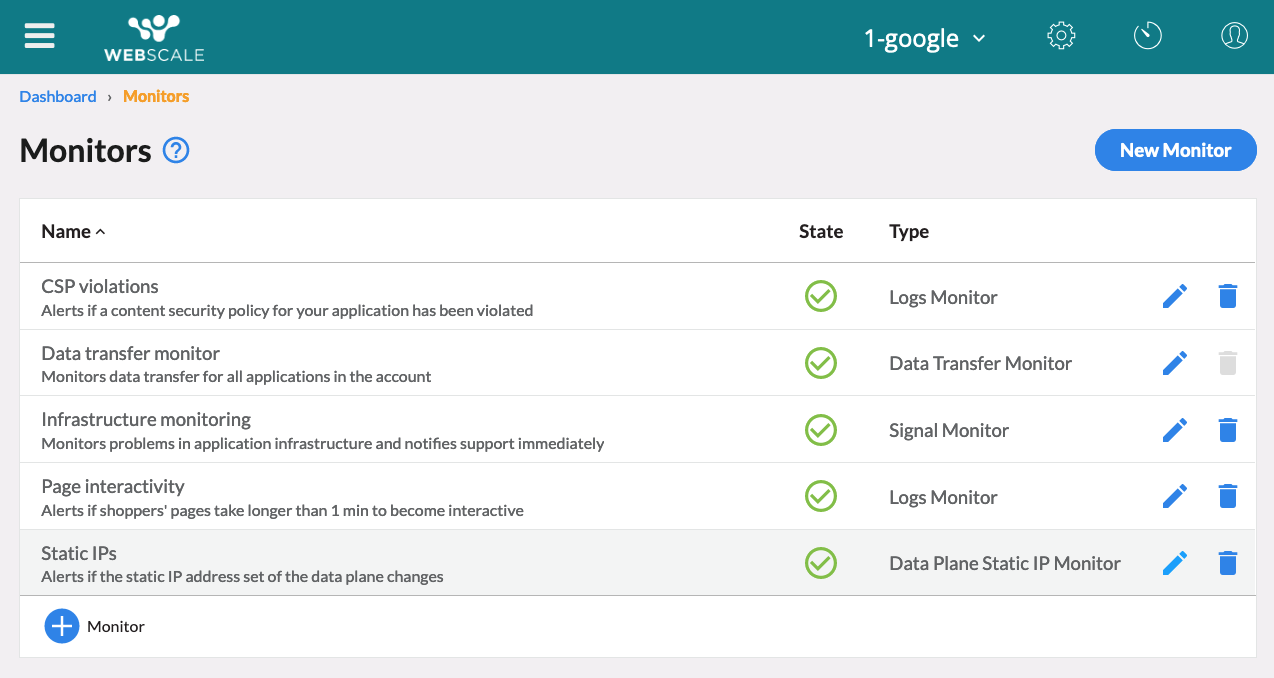
The data transfer monitor is present by default and always lists on the Monitors page. It tracks data transfer usage for all account applications. It is the only monitor with the data-transfer-billing type. While you can edit this monitor, you cannot delete it.
The information that the data transfer monitor collects provides the content for the Data Transfer report.
Logs monitor
You can view your site’s activity in near real-time through Traffic Viewer, which uses Webscale traffic logs information. These logs document the activity for each application.
You can configure monitors for each of the following logs types.
- CDN
- CSP (Content Security Policy)
- Pageview
- Proxy
Through CDN and Proxy logs, you can view the activities that your site’s CDN and application generate. Pageview logs can provide insight into your user experience. CSP reports inform you of violations of your site’s security policy.
Data plane monitor
The data plane monitor lets you know when changes have been made to a particular attribute of the data plane being monitored.
You can use Monitors page to perform the following operations.
Data planes
Data planes are sets of proxies that service all of your application traffic. They sit between your application and the internet, functioning as reverse proxies. Data planes can perform many functions, such as load balancing, protecting your application, and caching.
Each application is connected to a data plane. Your account can have multiple data planes. Multiple applications can share a single data plane.
IP addressing
Data planes enable you to manage proxies. Each proxy must have a public IP address. The cloud provider for the data plane, such as AWS, Azure, or Google Cloud Platform, allocates IP addresses for new proxies. When you create or edit a data plane, you can choose the method for assigning IP addresses.
One option is to use a pool of pre-allocated static IP addresses that the provider generates. When Webscale creates proxies for a data plane, it assigns IP addresses from the pool. For deleted proxies, Webscale returns the pre-allocated static IP address to the pool. It can then reassign the static IP address to new proxies.
Another method is for Webscale to allocate a new public IP address when it creates the proxy. The IP address does not belong to a pre-allocated pool. When Webscale deletes a proxy, the address will be released.
Data plane monitors and static IPs
Data plane monitors track changes to a specified attribute of a data plane.
The static_ips attribute enables the monitor to record a change to the static IP address set. Depending on the monitor configuration, the monitor can send a notification when a change occurs. For example, a monitor will trigger when static IP addresses are added to a data plane due to an increase in its maximum size.
You can create monitors and choose the static_ips attribute for data planes that do not have the static IP addressing feature enabled. These monitors track changes to this attribute for specified data planes. If you enable this feature for an existing data plane, Webscale will add the data plane’s existing IP addresses to its static IP address pool. The monitor will register the change. If you have entered an email address or VictorOps information, Webscale will then send a notification.
Create data plane monitors
You can create multiple data plane monitors. For instance, you might create a monitor for each of your data planes if you have more than one data plane. Or, you could create multiple monitors for one data plane with different recipients and messages for each monitor.
The Context tab of the Message section of the Create monitor dialog box contains some variables that are specific to the data plane monitor.
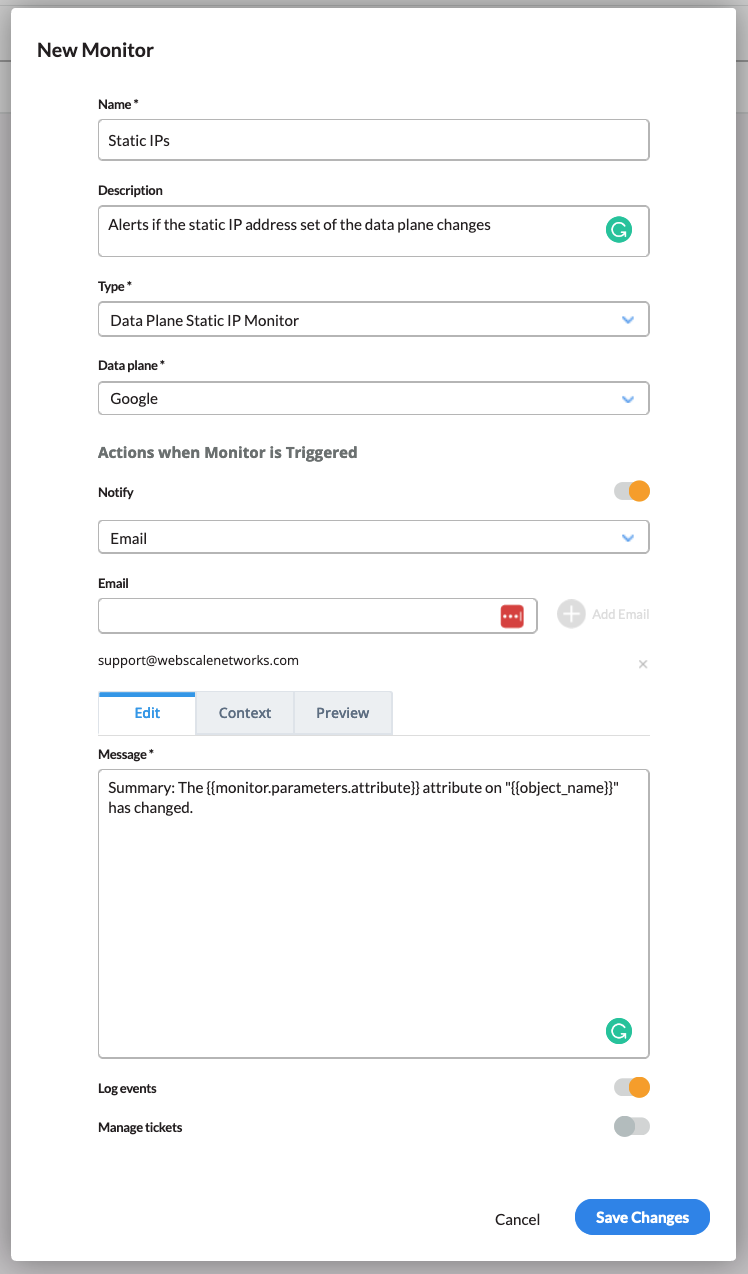
To create a data plane monitor
- On the Webscale Control Panel page, click the menu icon on the upper left of the screen.
- On the sidebar menu, select Monitors.
- In the Monitors page, click Create monitor.
- In the Create monitor dialog box, select the object-data-plane monitor type.
- Enter a monitor name.
- Optionally, enter a description for the monitor.
- To disable logging events that match monitor conditions, toggle the Log events switch to off.
- Specify the data plane to monitor by selecting it from the Data plane drop-down menu.
- Specify the attribute to monitor from the Attribute drop-down menu.
- Optionally, specify the notification recipients in the Notify section:
To send email notifications, make sure that the mailto option is selected in the drop-down menu and enter one or more email addresses. Click Add.
-or-
To use the Splunk On-Call third-party notification system, select victorops and enter the api and routing keys. Click Add.
- Define your message in the Message section.
- Click Save.
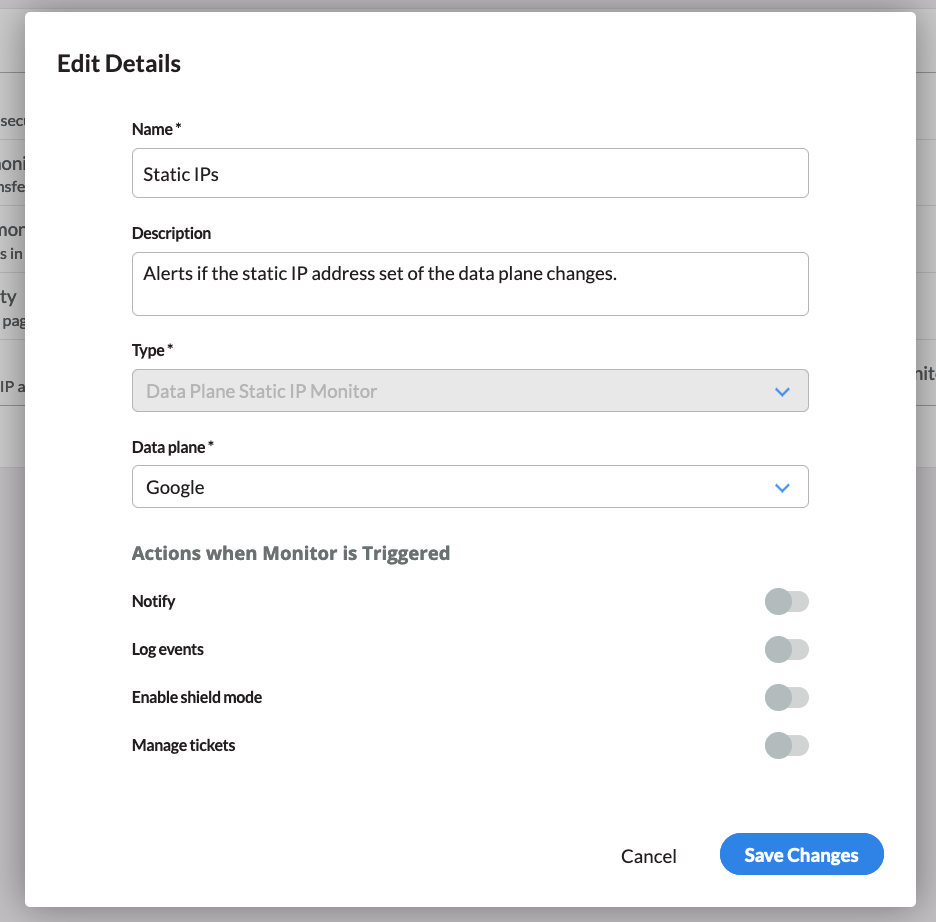
Edit data plane monitors
You can edit the details for a data plane monitor.
To edit a data plane monitor
-
On the Monitors page list, select the monitor.
-
Click the edit icon that displays for it.
-
In the Edit Monitor dialog box, modify the monitor settings.
-
Click Save.
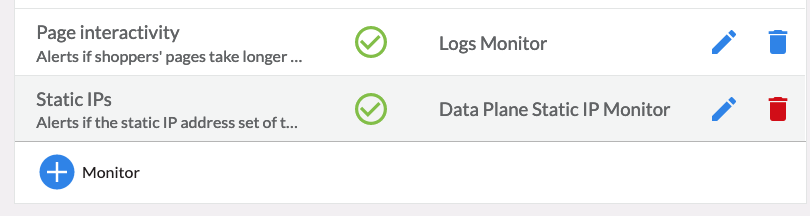
Delete data plane monitors
You can delete data plane monitors. If you plan to delete a data plane, you must delete any monitors for it before you can delete it.
To delete a data plane monitor
-
On the Monitors page list, select the monitor.
-
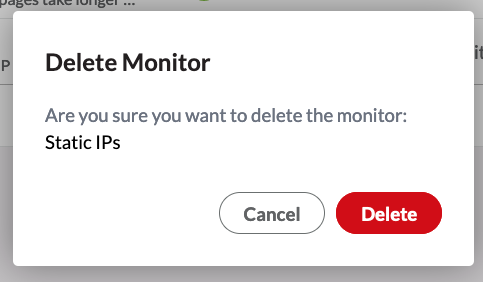
Click the Delete file icon that displays for it.
-
Click Ok in the confirmation box.
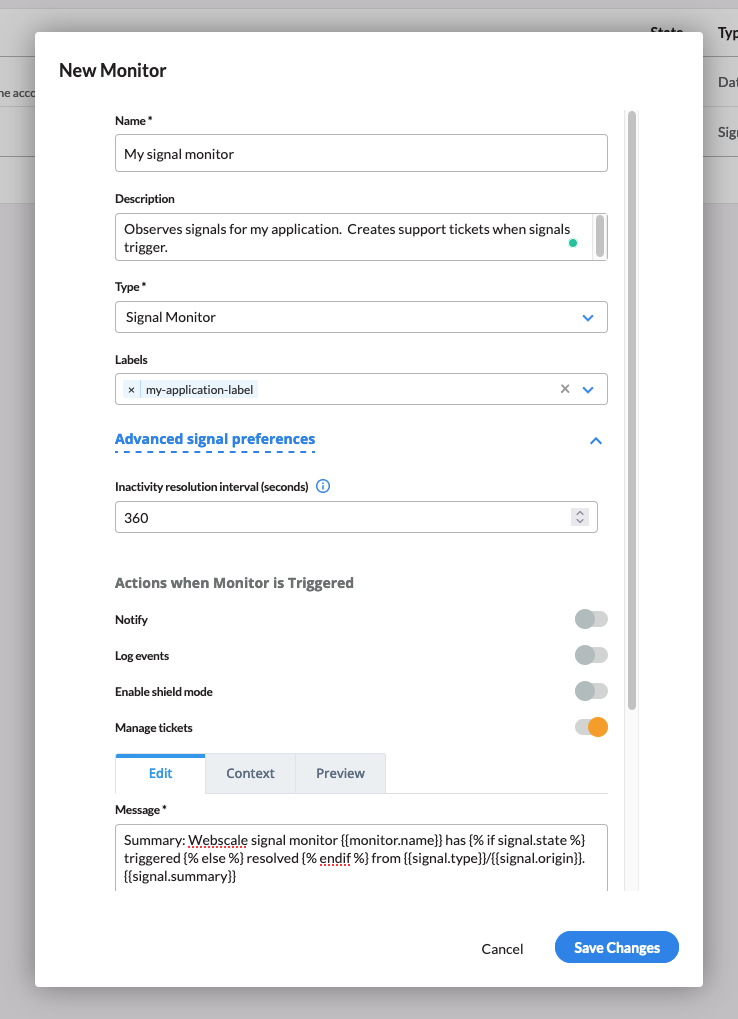
Signal monitors
Signal monitors inform you when signals for applications or accounts have been triggered or resolved.
Signals are stateful representations of problems that may occur with configured infrastructure. Monitors may be configured to observe signals for accounts or applications. For example, a signal may trigger when an application is unreachable from Australia and then will resolve when that application becomes reachable again.
Configure signal monitors
Signal monitors may have Labels configured. Labels are how to tell the monitor to observe signals for applications with matching labels. Application labels may be configured in the general application settings.
Note:
When no labels are configured for a signal monitor, the monitor will be observing signals for your account.In the advanced signal preferences, an Inactivity resolution interval may be configured. This interval represents an amount of time in seconds that must pass while all relevant matched signals are resolved before resolving the state of a signal monitor.
Application monitors
Application monitors will trigger when certain configuration or resource-specific criteria are met. At this time, the only resources considered are TLS certificates. The user can configure how many days before expiration the monitor should trigger under the TLS certificates section. If the monitor is configured with a Notify action, an email will be sent to the configured recipients once a day until the certificate is replaced.
Note:
Application monitors run once a day. They are not automatically run when the monitor’s configuration is changed. This means it may take up to a day for a new email recipient to receive their first notification.Any number of application monitors may be configured in the account, each targeting different labeled applications, with different customized configurations.
Note:
When no labels are configured on an application monitor, all applications in the account will be monitored.Note:
By default, an application monitor is automatically created when the first application of an account is created. The monitor will trigger when any certificate in the account will expire in the next 15 days.Further reading
- Viewing Reports
- Using Traffic Viewer
- Building Filters in Traffic Viewer
- CDN Logs Attributes
- CSP Reports Attributes
- Pageview Logs Attributes
- Proxy Logs Attributes
- Logs on Webscale
Have questions not answered here? Please Contact Support to get more help.
Feedback
Was this page helpful?
Glad to hear it! Have any more feedback? Please share it here.
Sorry to hear that. Have any more feedback? Please share it here.