Graphing Metrics
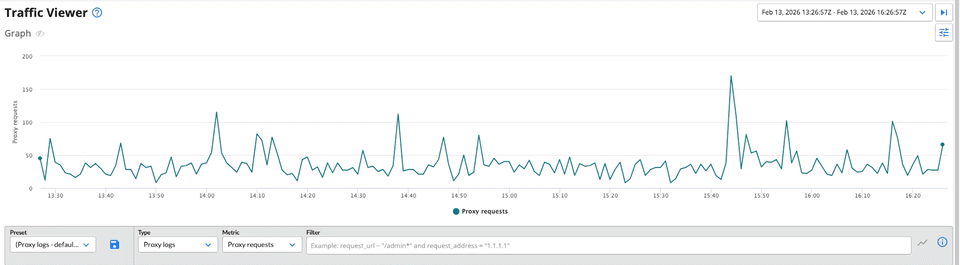
The Traffic Viewer graph provides a visualization of your application traffic. While the Records table offers a granular, line-by-line view of individual log records, the graph transforms this data into aggregated metric series. By mapping these metrics over a specified time range, you can quickly identify traffic spikes, service dips, or unusual patterns that warrant further investigation.
Traffic Viewer overview
To graph a single metric, select your log type and metric preference from the Type and Metric dropdowns in the Records table filter bar. For more advanced analysis—such as overlaying multiple metrics, comparing different log types, or applying unique filters to individual series—click the Configure icon in the top-right corner of the graph.

Graphing multiple metrics
Clicking the Configure icon will expand the Configuration panel to allow for the selection of multiple metrics (up to 5) across log types. Each row represents a new series that will be displayed in the Traffic Viewer graph. In order to graph another metric, simply select it from the “Select a metric…” dropdown.
In the Traffic Viewer graph, axes will be combined when series share the same unit. Otherwise, an additional y-axis will be provided. Hovering over the data will present a popover tooltip that displays the respective data for the nearest data point. To temporarily highlight a specific series, hover over the series label along the x-axis.
Clicking the Trash icon will remove the metric from the graph.

Applying filters to graphed metrics
When the Configuration panel is first expanded, the first entry is labeled “Records table”. This is a dynamic link: the metric and filters for this series are driven by your selections in the Records Table filter bar. Updating either of these fields in the Records table filter bar will affect the series metric displayed in the graph.
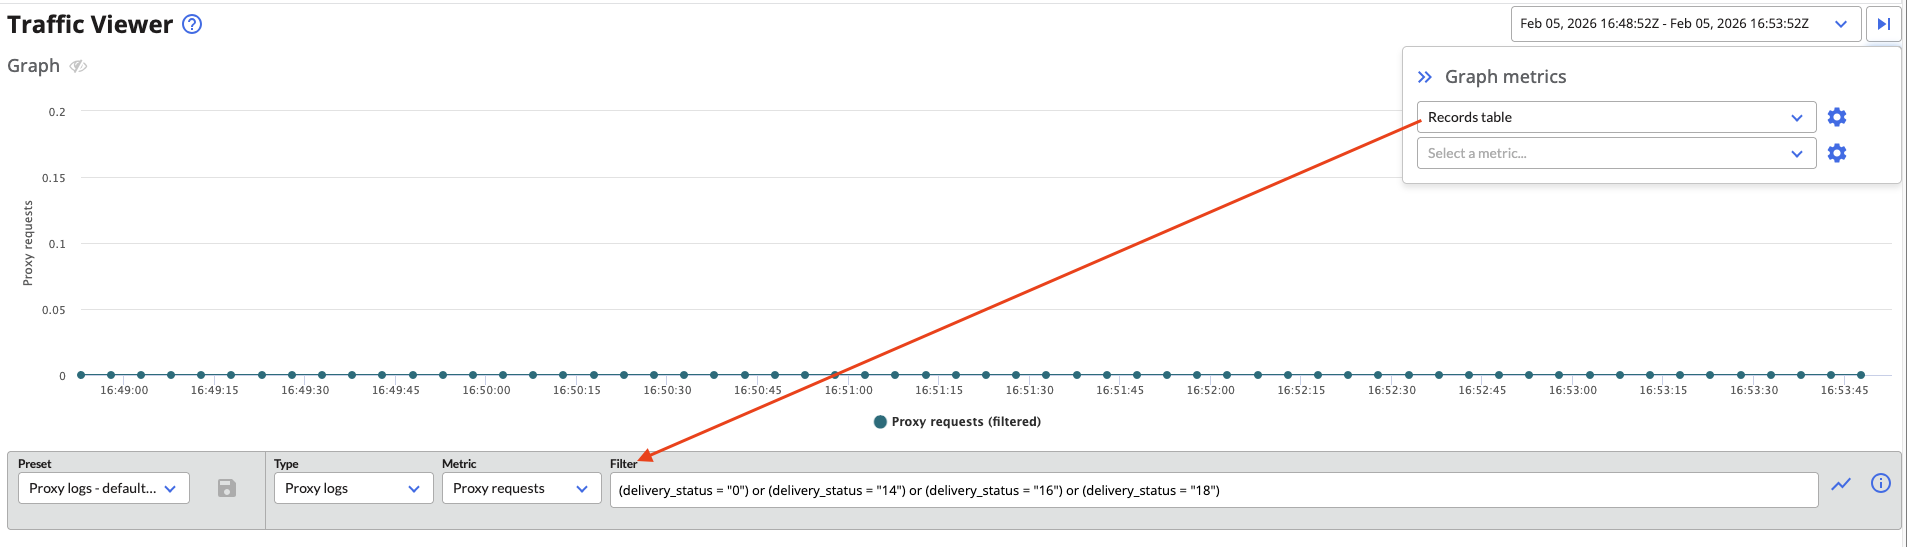
To modify the other metrics graphed, click the Settings icon next to the desired metric in the Configuration panel. This will open the Metric definition panel which allows you to apply a filter that applies only to the selected metric.
Unlinking and linking the records table filter
If you would like to search through log records without affecting the graphed metrics, you can do so by unlinking the records table from the graph. Toggle the Line graph icon in the Records table filter bar and the Records table will then become unlinked from the graph. The existing metric and filter will be preserved in the corresponding “Records table” metric, if it is still displayed, and the corresponding metric selector will be updated to show that it is no longer linked to the “Records table”.
If the “Records table” metric has been unlinked from the graph (Line graph icon appears gray), but you would like to display a graph using the metric and filter from the Records table filter bar, you can toggle the Line graph icon and the graph will update with “Records table” displayed as a graphed metric.
Available metrics
| Source | Description | Metrics |
|---|---|---|
| Application | Core metrics representing the health and capacity of the application. | Requests, Cluster server count, Rejected requests, Static server count, Suspended requests |
| CDN | Data transfer and delivery metrics from the Content Delivery Network. | Bytes in, Bytes in rate, Bytes out, Bytes out rate, Content length, Content length rate, Elapsed, Range end, Range start, Requests, Requests rate, TTFB |
| Cluster | Infrastructure-level telemetry monitoring the physical or virtual resources powering your application. | CPU utilization, Disk space, Disk utilization, IO wait percent, Memory utilization, Normalized load |
| CSP | Content Security Policy metrics tracking browser-reported security violations. | Reports, Reports rate |
| Events | Aggregated counts of system-generated log events categorized by severity level. | All events, Info, Severe, Warning |
| Pageviews | Real-user monitoring (RUM) data focusing on browser-side performance and core web vitals. | Pageviews, DOM content loaded, DOM interactive, Elapsed, First contentful paint, Largest contentful paint, Rate, Ready state interactive, TTFB |
| Proxy | Detailed traffic metrics from the data plane layer, including latency breakdowns and security threats. | Bytes in, Bytes in rate, Bytes out, Bytes out rate, Elapsed, Internal latency, Queue latency, Requests, Requests rate, Server latency, Threats, TTFB |
| Sessions | Aggregated user experience data tracking session duration and average load performance. | Elapsed, Page load average, Page load LCP average, Page load TTFB average, Rate |
Feedback
Was this page helpful?
Glad to hear it! Have any more feedback? Please share it here.
Sorry to hear that. Have any more feedback? Please share it here.