Stratus Guides - Using Xdebug
While a powerful tool, Xdebug can drastically slow down a store if used in production, even when not actively tracing or profiling anything. It is highly advised to not use Xdebug on a Production environment unless absolutely necessary.
Xdebug has a variety of settings. By default Xdebug is configured in Webscale STRATUS to cover most situations. There are three ways to use Xdebug:
- Profiling — outputs cachegrind files on the Webscale STRATUS file system to evaluate request performance
- Tracing — outputs trace files on the file system with full output of all function calls with function processing times
- Debug — connects a local IDE via SSH tunnel on Webscale STRATUS to step through code when called via browser request
Setup
-
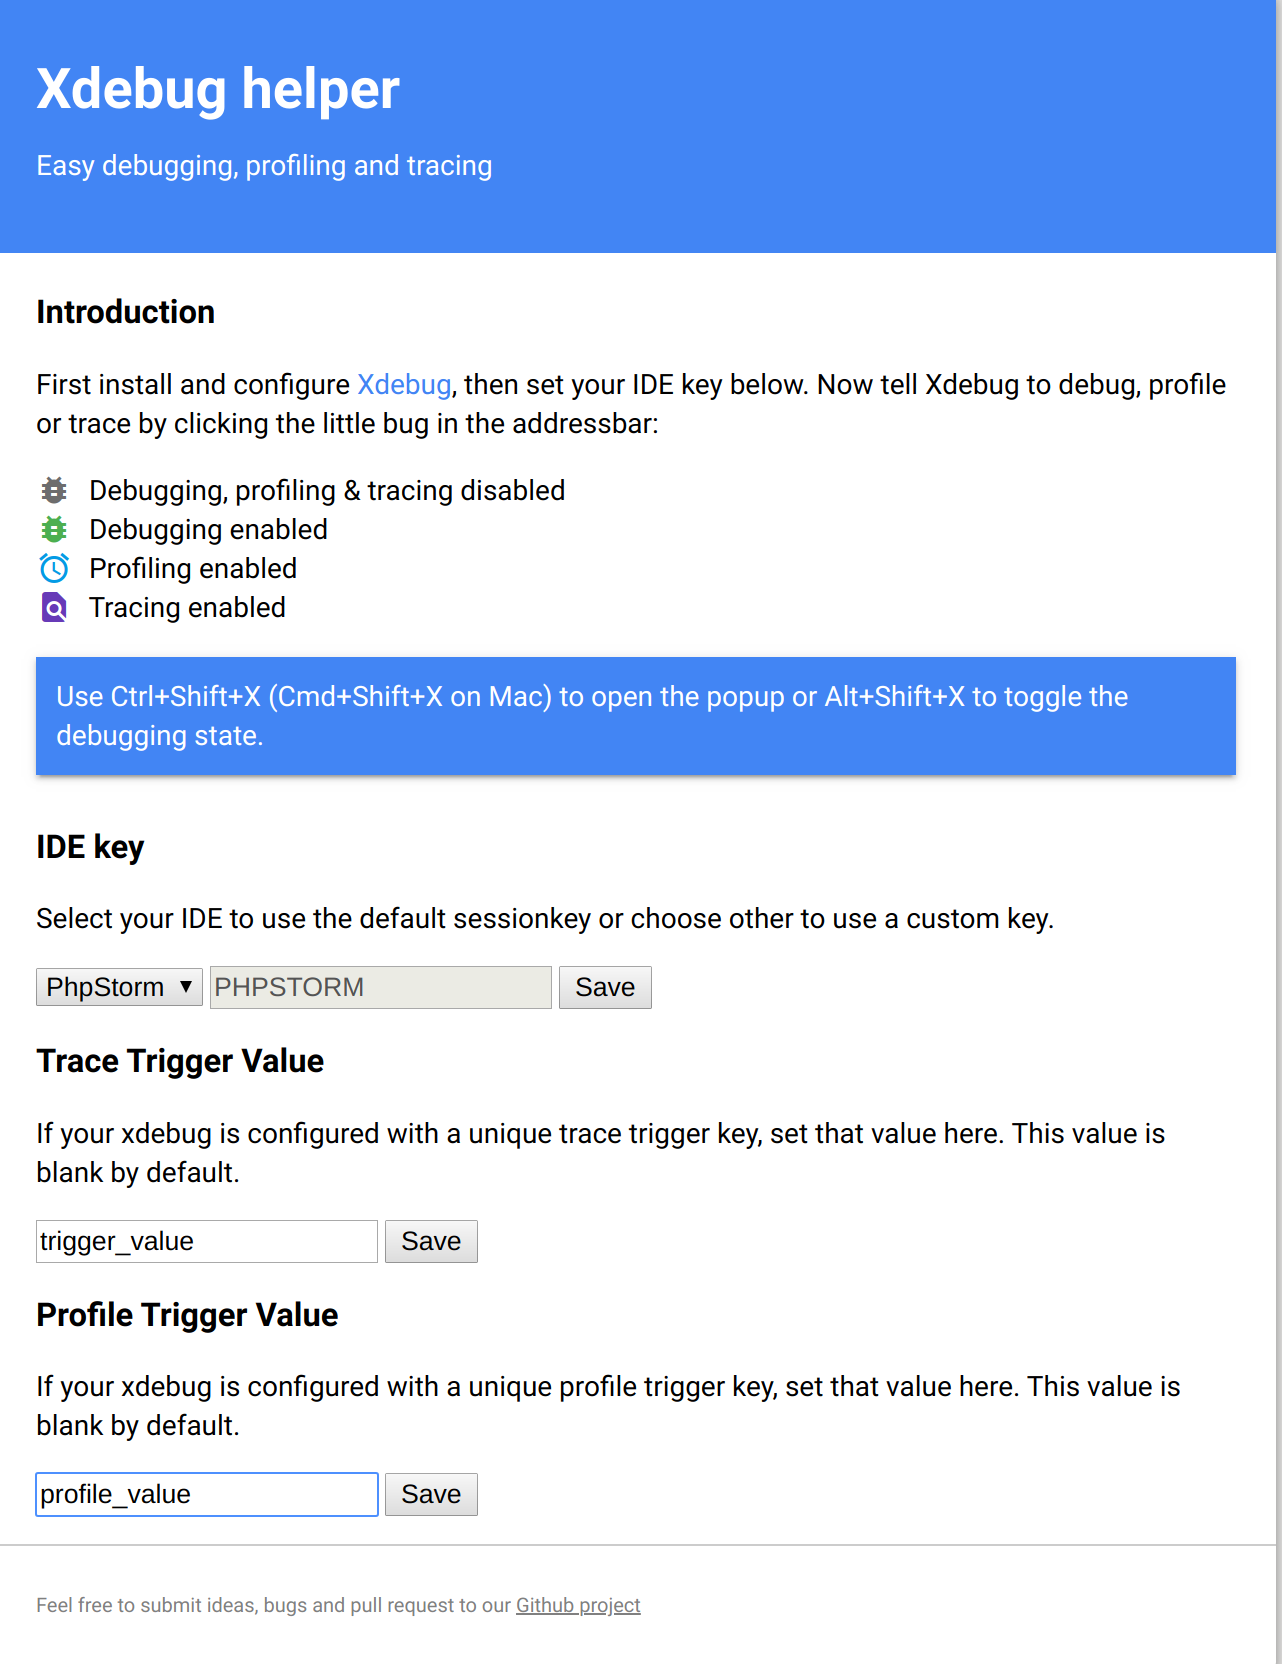
Install the Chrome extension to trigger the profiling and tracing in Xdebug.
-
If Varnish is running, disable it.
-
Enable Xdebug in the [PHP > Xdebug][2] Admin panel.
Before enabling Xdebug, set a trace and profiler value, along with a IDE key. The IDE key is not strictly necessary on STRATUS. The trace and profiler values will be used by the XDebug helper extension to trigger cachegrind or tracefile generation.
Once the profile values are set, click Update. The site will go down for a minute or two while PHP is reloaded with XDebug enabled. If Blackfire is enabled, a warning will be generated.
**NOTE: ** Blackfire and XDebug cannot and should not be enabled at the same time.
XDebug is now enabled and ready for use. If XDebug Helper is installed, edit the option for the extension to match what you set in your Webscale STRATUS panel.
Tracing and Profiling
With XDebug helper, click the debug icon and choose either Profile or Trace from the available modes. Then load any page on the site to be diagnosed.
After a longer than normal page load, check the filesystem on the Webscale STRATUS environment. There will be a directory called xdebug in /srv/.
Depending on the option chosen in the XDebug helper, there will be either a cachegrind.out.(xxxx) file or a trace.(xxxx).(xxxx).xt file. Cachegrind files can be viewed with tools like KCacheGrind or WinCacheGrind and are profiles of the page request. The .xt files are raw text showing the series of function calls made in the web request.
Remote Debugging with Breakpoints
Note the examples below use PHP Storm and VS Code, both common IDEs. If using another IDE, it is likely the settings here will be similar. There may also be other plugins and settings to use in either IDE.
VS Code
Setup:
-
Install the PHP Debug Plugin
-
Open VS Code to a copy of the Magento site code
-
Configure the PHP Debug Plugin, this simple snippet should be in the
launch.jsonfile:{ "version": "0.2.0", "configurations": [ { "name": "Listen for XDebug", "type": "php", "request": "launch", "port": 9000, "pathMappings": { "/srv/public_html/pub/": "${workspaceRoot}", } } ] } -
Change the path mapping to suit. Add a breakpoint somewhere in your code. Presumably on code you know will be executed on your request.
-
Open an SSH tunnel to your environment with parameters:
ssh -p <stratus_port> <username>@<hostname> -R :9001:127.0.0.1:9000 -
Click the bug Icon in VS Code to Debug and Run.

-
Request a page on the site for debugging, with a link such as:
https://yoursite.com/test.php?XDEBUG_SESSION_START=1
The query string will trigger XDebug to begin debugging, and the output will appear in the variables column in the left side in XDebug. Use the VS Code debug interface to continue stepping through your code.
PhpStorm
The JetBrains IDE costs money and is very powerful, yet setup is a breeze. Similar to VS Code, an SSH tunnel is still required.
-
Open the code base in PhpStorm
-
Press Ctrl-Alt-S to open the PhpStorm settings menu. Go to Languages and Frameworks -> PHP -> Debug.
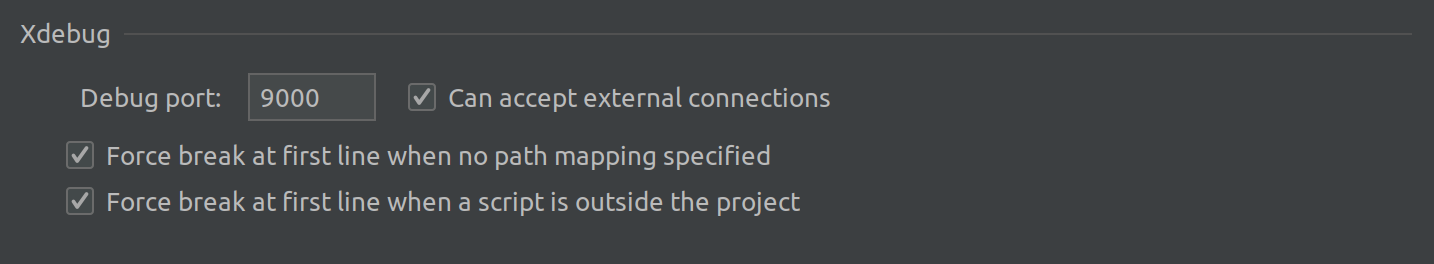
-
Set the XDebug section as shown above.
-
Open an SSH tunnel to the Webscale STRATUS environment.
ssh -p <stratus_port> <username>@<hostname> -R :9001:127.0.0.1:9000 -
In the Magento code base/project, set breakpoints in PhpStorm.
-
Enable the XDebug listener via the Phone icon in the top right of the editor, or in the Settings menu under the Debug settings of PHP there is a link, Start Listening.
-
Request a page on your site for debugging, with a link such as:
https://yoursite.com/test.php?XDEBUG_SESSION_START=1
A prompt will pop-up showing that debugging is active.
Feedback
Was this page helpful?
Glad to hear it! Have any more feedback? Please share it here.
Sorry to hear that. Have any more feedback? Please share it here.