Stratus Panel - Vitals
Alerts
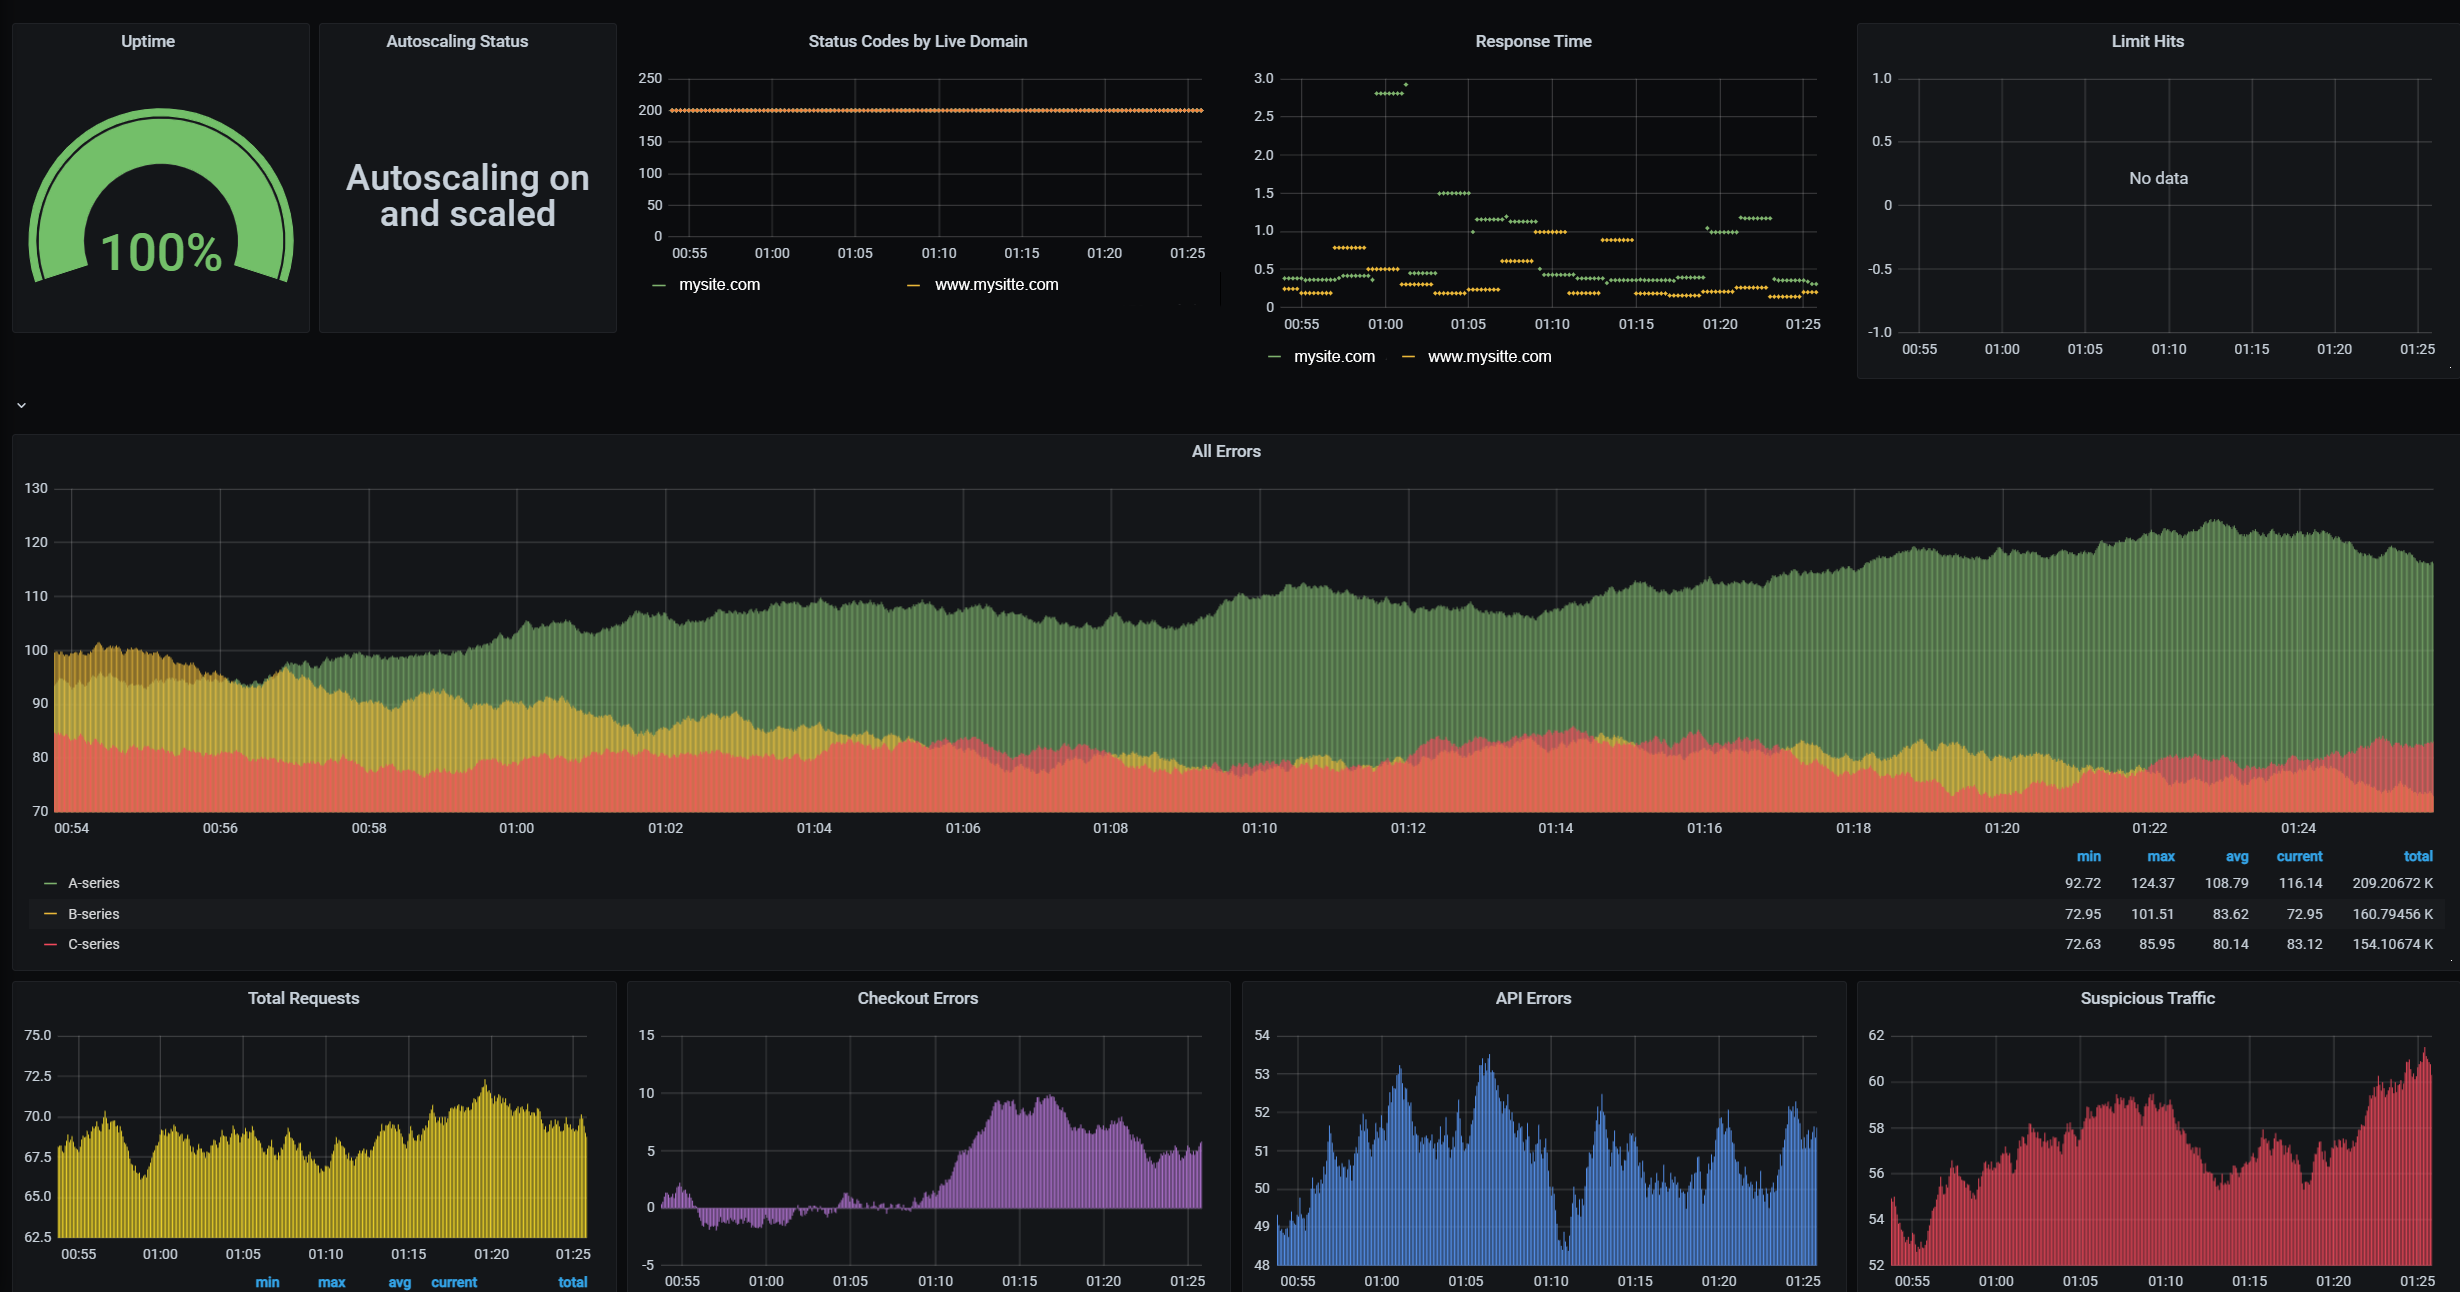
Uptime: Uptime based as probe success within the chosen time frame. Only monitored if your environment is considered live.
Autoscaling Status: This reports if Autoscaling is ON or OFF. If you are on a legacy Resource Based Plan (RBP), this will be N/A.
Status Codes: HTTP Status Codes per domain within the chosen time frame. Only monitored if your environment is considered live.
Response Time: Response time in seconds within the chosen time frame. Only monitored if your environment is considered live.
Limit Hits: This shows any service limits you have hit within the chosen time frame. If you find your production store routinely hitting limits , especially MySQL, the environment may need an upgrade.
All Errors: Total errors the site has received within the chosen time frame.
Total Requests: Total requests per second.
Checkout Errors: Errors the site has received related to checkout within the chosen time frame.
API Errors: Errors the site has received related to API within the chosen time frame.
Suspicious Traffic: Malicious Traffic hits within the chosen time frame.
NOTE: Your environment is counted as live when it uses a domain other than its Webscale provided temporary domain name. Development instances will not show this information.
Overview
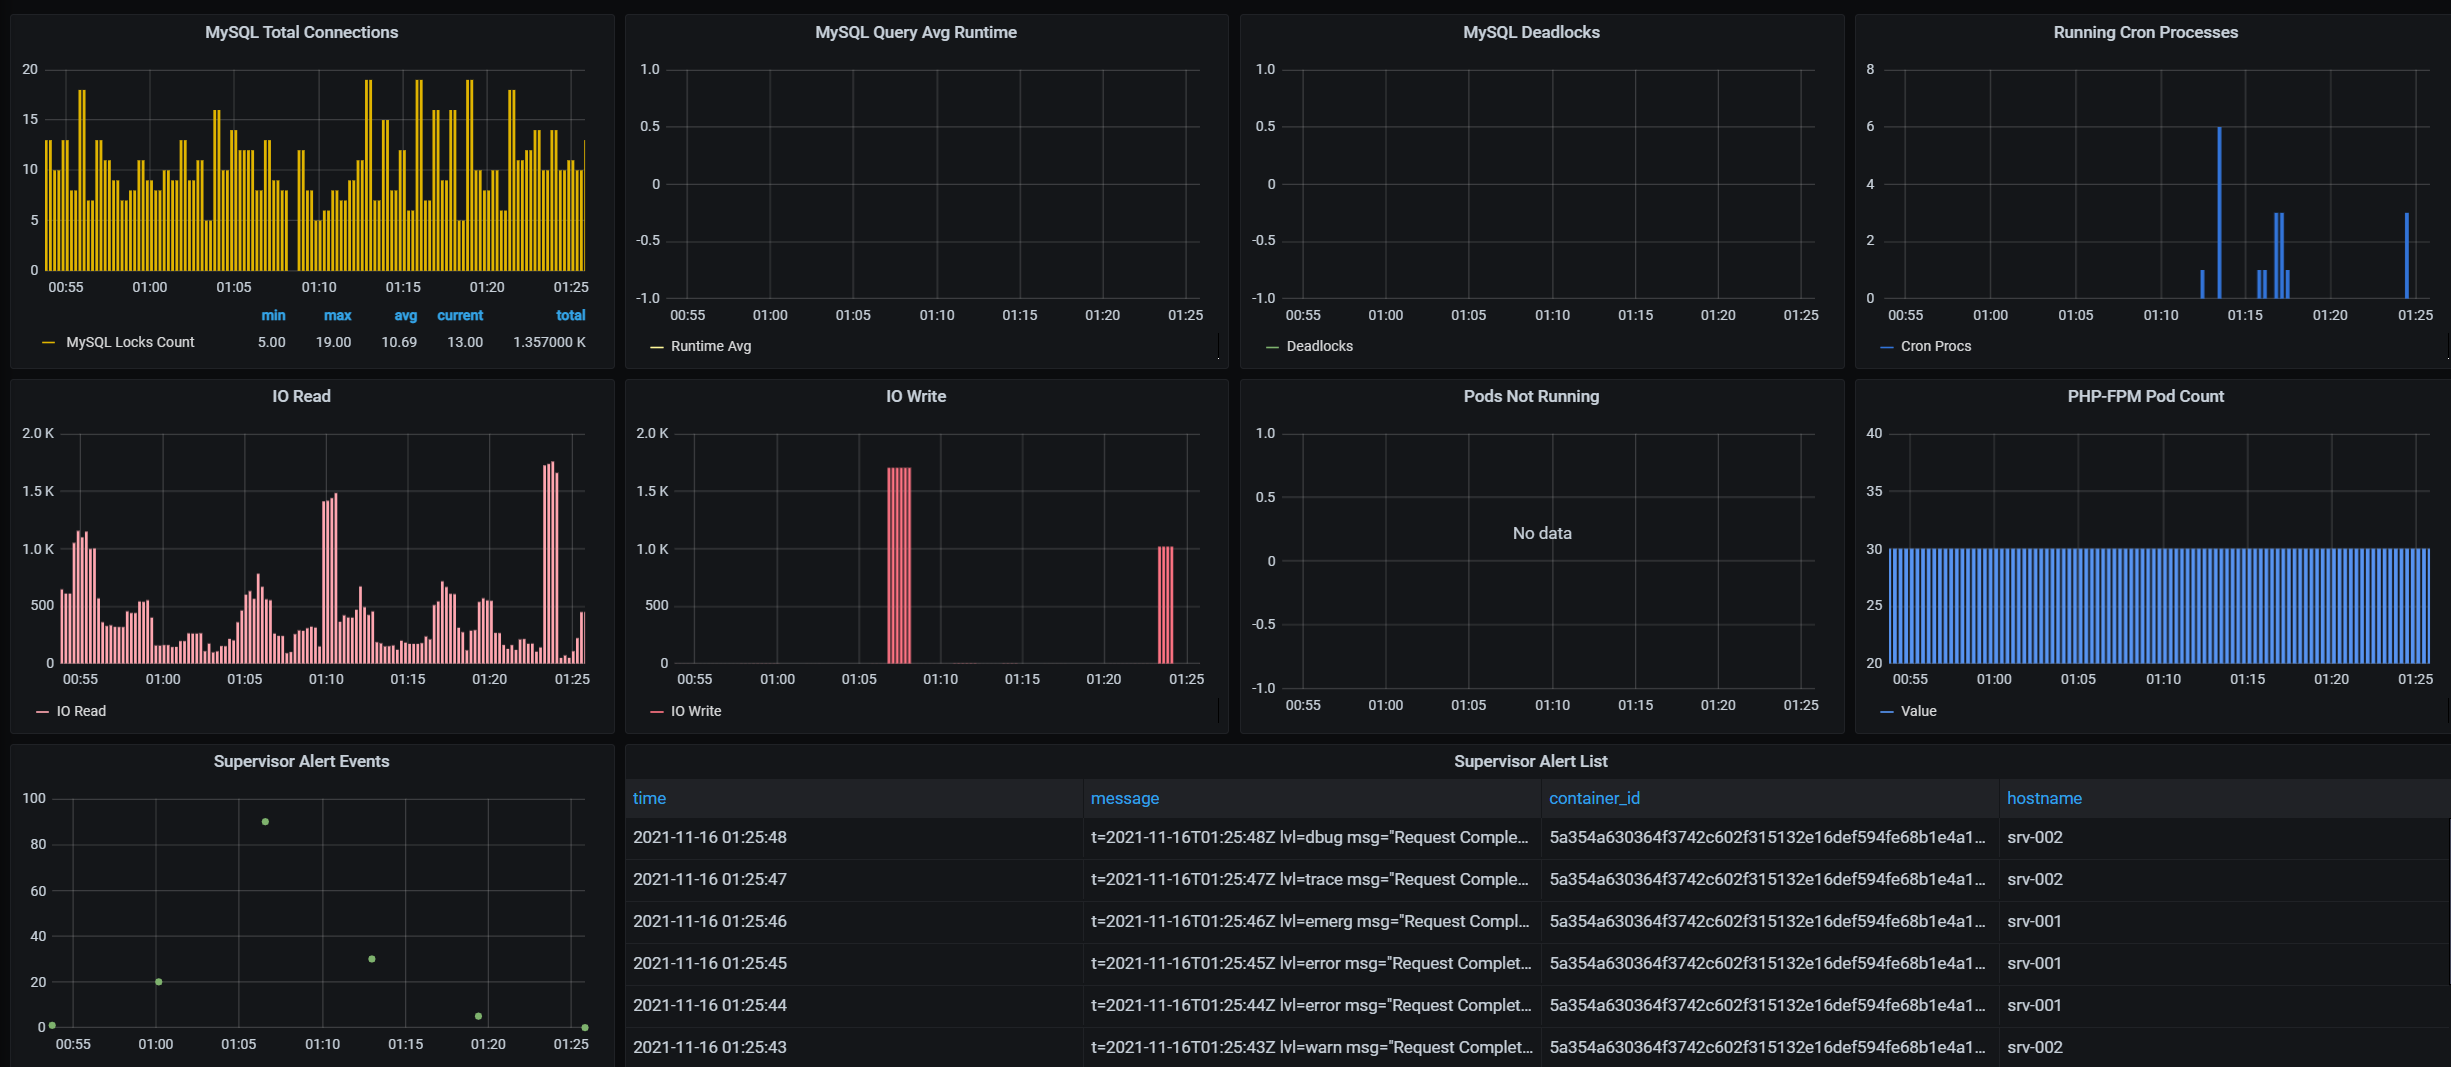
- MySQL Total connections: The total amount of MYSQL connections within the chosen time frame.
- MySQL Query Runtime: The average query Runtime for queries running in your environment.
- MySQL Deadlocks: MySQL locks that have occured in this environment within the chosen time frame.
- Running Cron Processes: The amount of running cron processes within the chosen time frame.
- IO Read: Input/Output reads to the file system and database for the environment within the chosen time frame.
- IO Write: Input/Output writes to the file system and database for the environment within the chosen time frame.
- Pods not running: The amount of pods not in the running state within the specified time frame. This can be due to a redeploy.
- PHP-FPM Pod Count: Count of PHP-FPM Pods. If Autoscaling is enabled, this graph will display the rise and fall of PHP-FPM pods which depends on the amount of traffic your environment is receiving. You will also see this change during zero downtime deployments after a new set of pods is launched during a deploy & before a switch takes place.
- Supervisor Alert Events: A graphical representation of Supervisor events that have occured within the chosen time frame.
- Supervisor Alert List: This is a list of Alerts related to Health checks in your environment such as Runaway MySQL processes , Runaway Crons , or High IO , CPU , Swap Memory or Load Average .
Service Detail
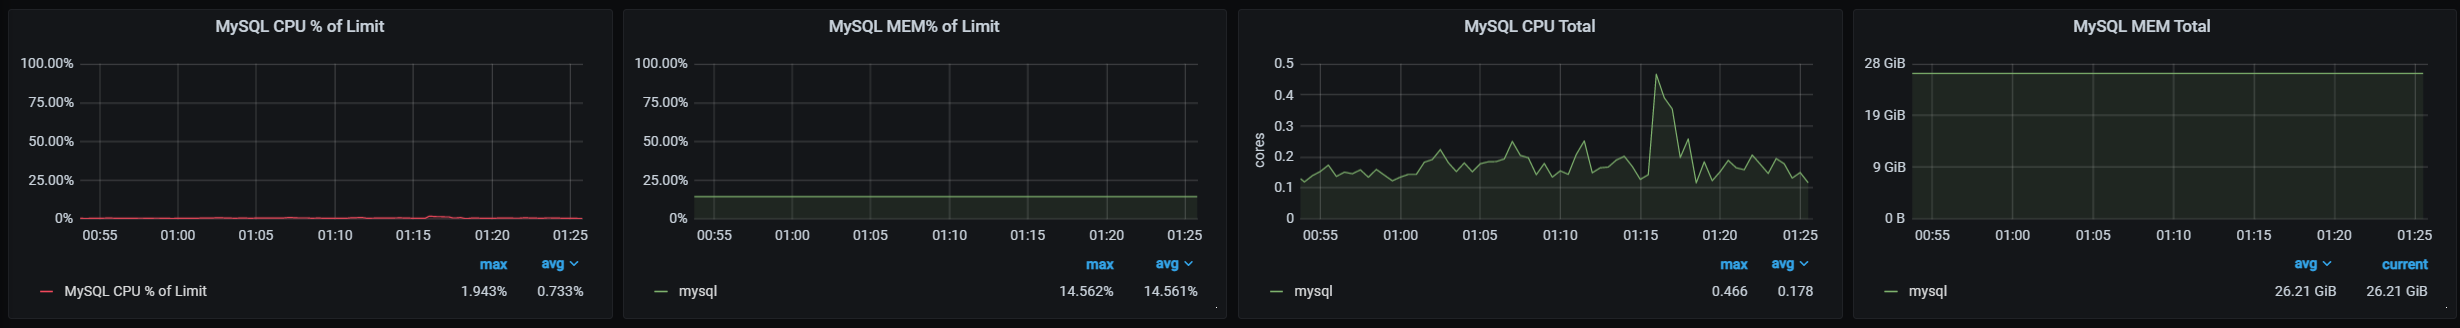
Webscale STRATUS Vitals provides CPU & Memory information for the services in your environment.
MySQL
- CPU % of Limit: MySQL CPU usage as a percentage of the limit provided by your plan .
- MEM % of Limit: MySQL Memory usage as a percentage of the limit provided by your plan .
- CPU Total: The total amount of CPU cores used by MySQL.
- MEM Total: The total amount of Memory used by MySQL. If this is high, it can signify that you need to upgrade your plan.
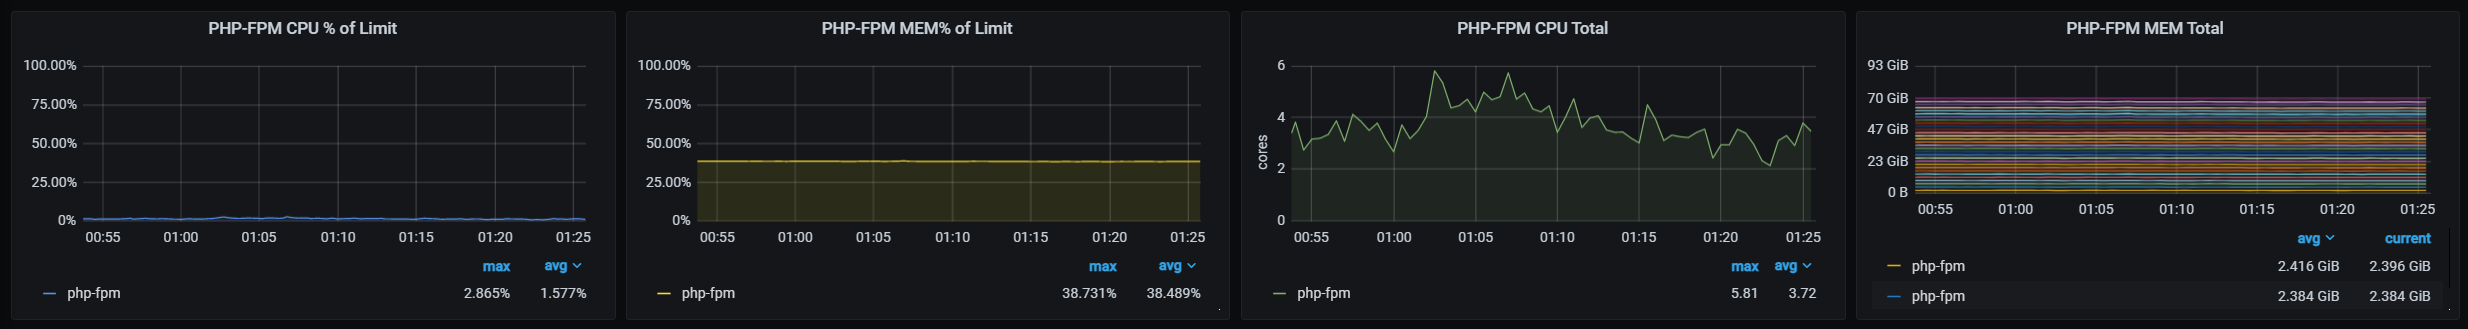
PHP-FPM
- CPU % of Limit: PHP-FPM CPU usage as a percentage of the limit.
- MEM % of Limit: PHP-FPM Memory usage as a percentage of the limit.
- CPU Total: The total amount of CPU cores used by PHP-FPM pods.
- MEM Total: The total amount of Memory used by PHP-FPM pods.
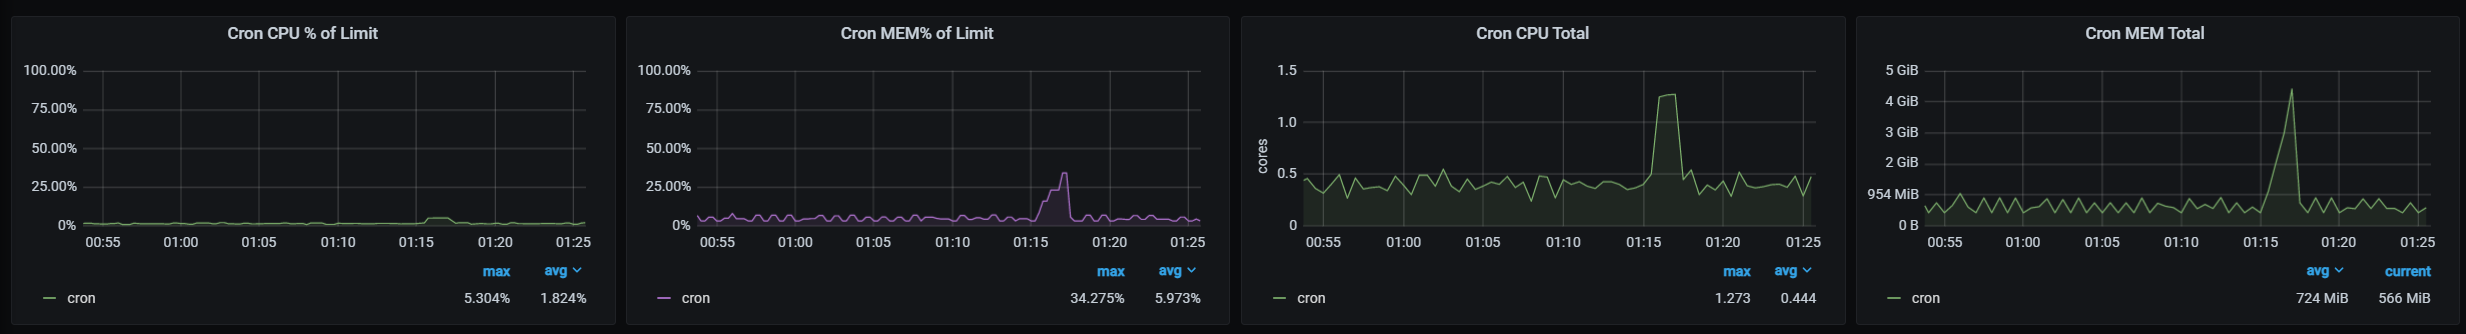
Cron
- CPU % of Limit: Cron CPU usage as a percentage of the limit provided by your plan .
- MEM % of Limit: Cron Memory usage as a percentage of the limit provided by your plan .
- CPU Total: The total amount of CPU cores used by Cron.
- MEM Total: The total amount of Memory used by Cron.
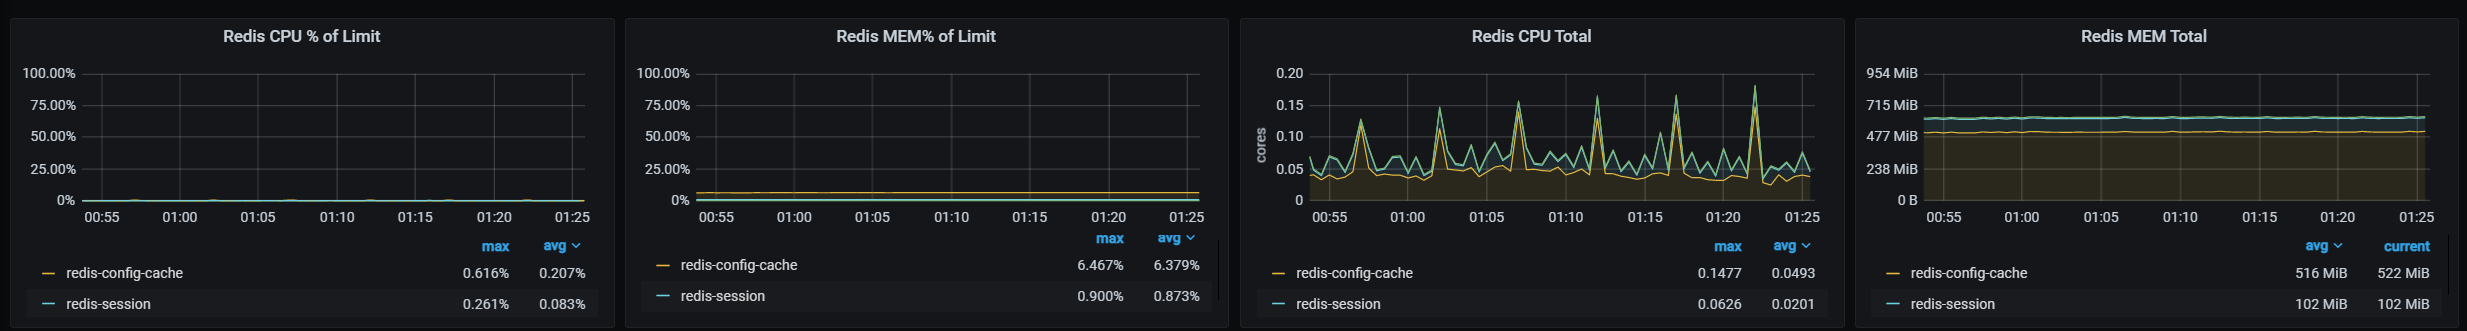
Redis
- CPU % of Limit: Redis, Redis Config Cache & Redis Session CPU usage as a percentage of the limit provided by your plan .
- MEM % of Limit: Redis, Redis Config Cache & Redis Session Memory usage as a percentage of the limit provided by your plan .
- CPU Total: The total amount of CPU cores used by Redis, Redis Config Cache & Redis Sessions.
- MEM Total: The total amount of Memory used by Redis, Redis Config Cache & Redis Sessions.
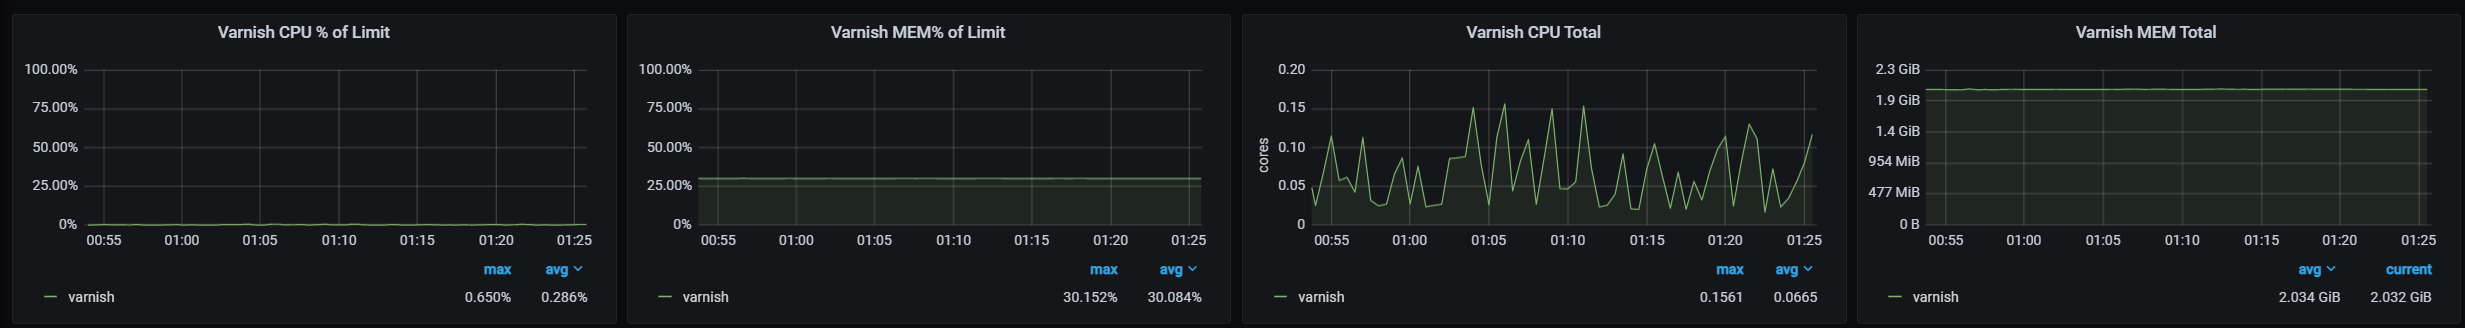
Varnish
- CPU % of Limit: Varnish CPU usage as a percentage of the limit provided by your plan .
- MEM % of Limit: Varnish Memory usage as a percentage of the limit provided by your plan .
- CPU Total: The total amount of CPU cores used by Varnish.
- MEM Total: The total amount of Memory used by Varnish.
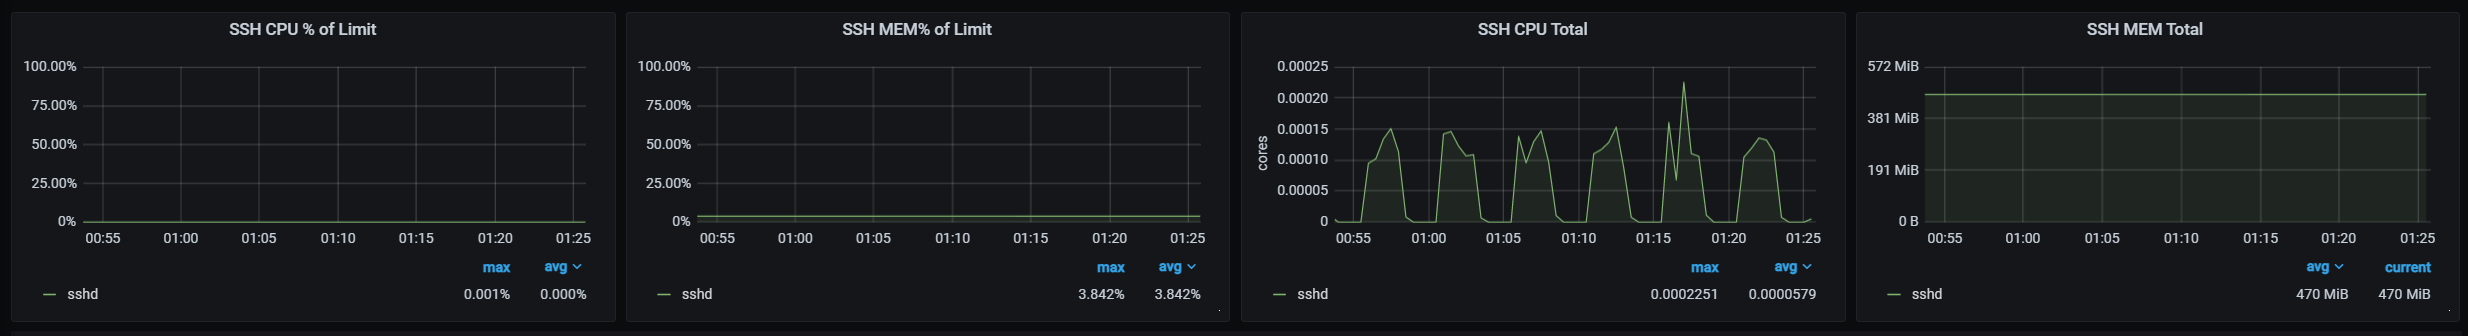
SSH
- CPU % of Limit: SSH usage as a percentage of the limit provided by your plan .
- MEM % of Limit: SSH Memory usage as a percentage of the limit provided by your plan .
- CPU Total: The total amount of CPU cores used by the SSH container.
- MEM Total: The total amount of Memory used by the SSH container.
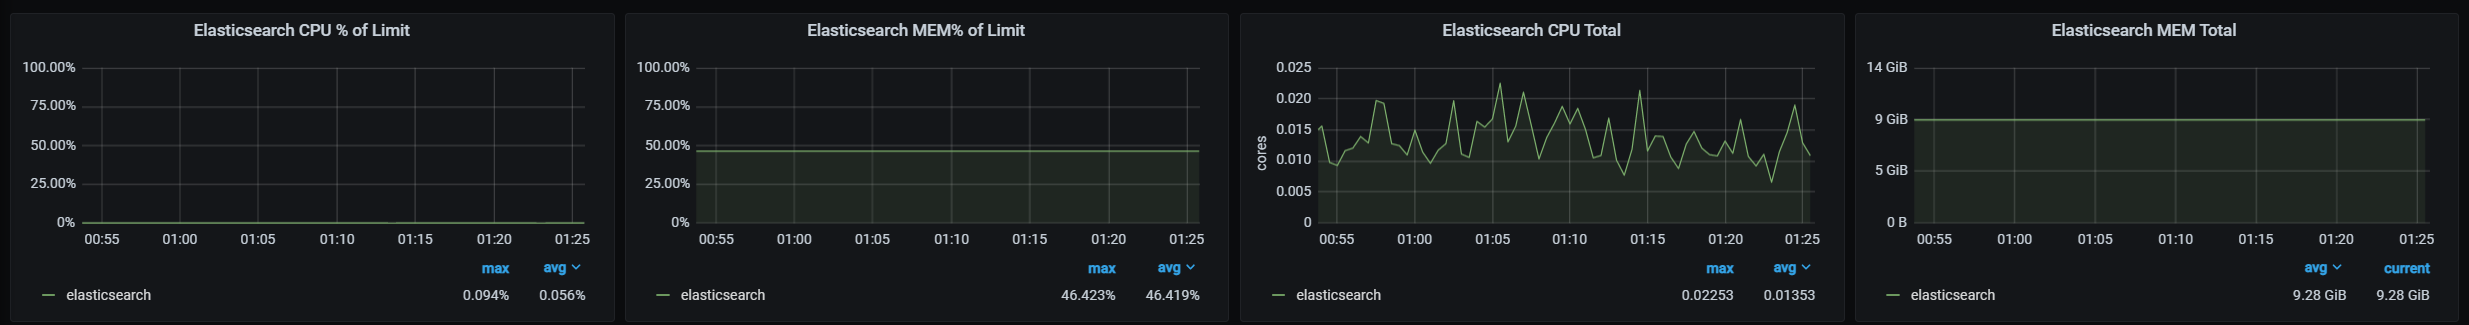
Elasticsearch
- CPU % of Limit: Elasticsearch CPU usage as a percentage of the limit provided by your plan .
- MEM % of Limit: Elasticsearch Memory usage as a percentage of the limit provided by your plan .
- CPU Total: The total amount of CPU cores used by Elasticsearch.
- MEM Total: The total amount of Memory used by Elasticsearch.
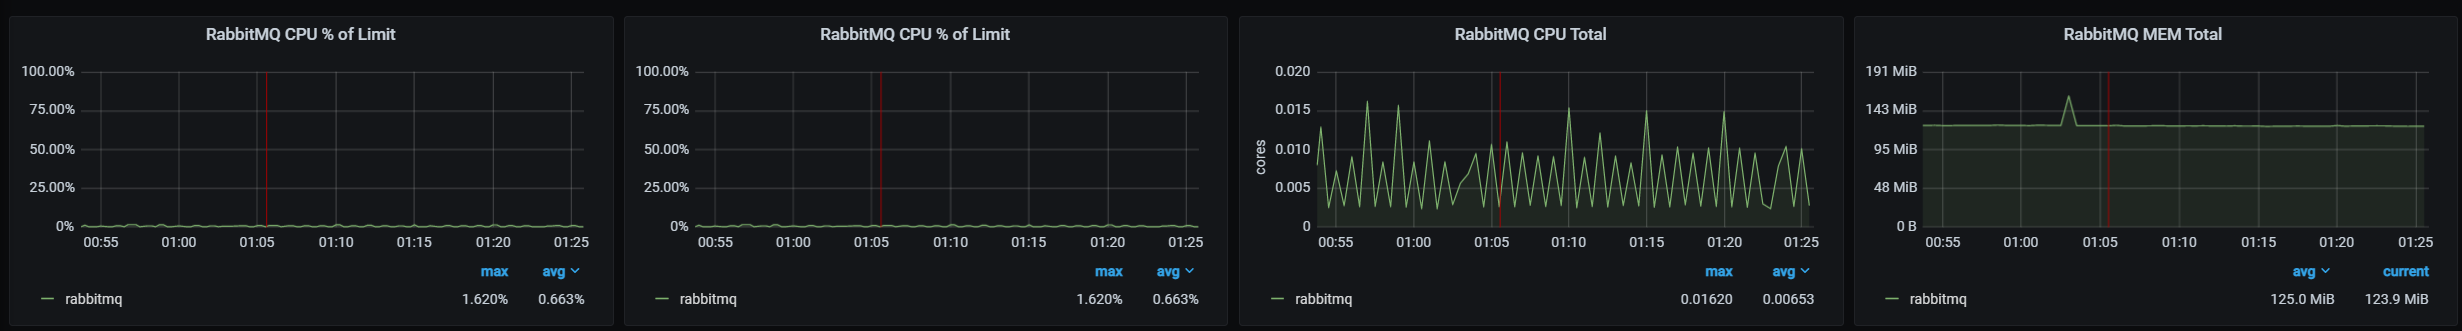
RabbitMQ
- CPU % of Limit: RabbitMQ CPU usage as a percentage of the limit provided by your plan .
- MEM % of Limit: RabbitMQ Memory usage as a percentage of the limit provided by your plan .
- CPU Total: The total amount of CPU cores used by RabbitMQ.
- MEM Total: The total amount of Memory used by RabbitMQ.
NodeJS
- CPU % of Limit: NodeJS CPU usage as a percentage of the limit provided by your plan .
- MEM % of Limit: NodeJS Memory usage as a percentage of the limit provided by your plan .
- CPU Total: The total amount of CPU cores used by NodeJS.
- MEM Total: The total amount of Memory used by NodeJS.
Sphinx
- CPU % of Limit: Sphinx CPU usage as a percentage of the limit provided by your plan .
- MEM % of Limit: Sphinx Memory usage as a percentage of the limit provided by your plan .
- CPU Total: The total amount of CPU cores used by Sphinx.
- MEM Total: The total amount of Memory used by Sphinx.
Memcache
- CPU % of Limit: Memcache CPU usage as a percentage of the limit provided by your plan .
- MEM % of Limit: Memcache Memory usage as a percentage of the limit provided by your plan .
- CPU Total: The total amount of CPU cores used by Memcache.
- MEM Total: The total amount of Memory used by Memcache.
Last modified on June 3, 2026